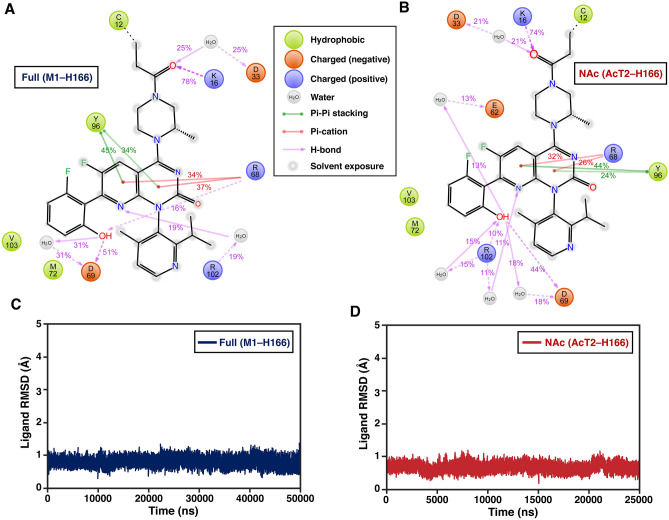
Figure 2.
KRAS(G12C)–AMG 510 interactions in the MD simulations. (A) Observed KRAS(G12C)–AMG 510 interactions with the simulations of Full (M1–H166) systems (total of 50 μs simulation data). (B) Observed KRAS(G12C)–AMG 510 interactions with the simulations of NAc (AcT2–H166) systems (total of 25 μs simulation data). Interactions that occur more than 10% of the simulation time are displayed. (C) Ligand root-mean-square deviation (RMSD) in the simulations of Full (M1–H166) systems. (D) Ligand RMSD in the simulations of NAc (AcT2–H166) systems.

