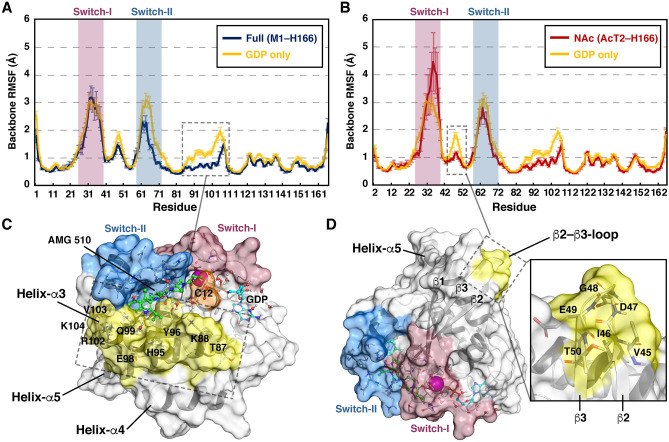
Figure 3.
Root-mean-square fluctuations (RMSF) of protein backbone. (A) RMSF of full M1–H166 systems (50 μs simulation data). (B) RMSF of NAc (AcT2–H166) systems (25 μs simulation data). The ‘GDP only’ RMSF data in A and B is taken from previously published 70 μs KRAS–GDP simulations2. Error bars represent standard error. (C) Lower RMSF values are observed in both systems for the Helix-α3, which location and residues are highlighted in yellow (PDB ID: 6oim). (D) Lower RMSF values are observed with NAc systems for the β2–β3-loop, which location and residues are highlighted in yellow (PDB ID: 6oim).

