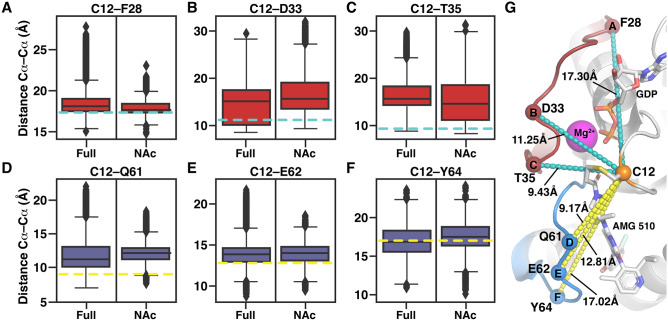
Figure 4.
Distances of switch regions to selected switch-I (A–C) and switch-II (D–F) residues. The corresponding locations of the monitored Cα atoms (spheres) and their distances in the AMG 510 crystal structure (PDB ID: 6oim) are illustrated with cyan and yellow dashed lines in A–F. The black horizontal line in the box represents the median. Box displays the quartiles of the dataset (25%–75%) and whiskers the rest of the data with maximum 1.5 IQR. Outliers are indicated with black diamonds. (G) Monitored distances represented in the KRAS(G12C)–AMG 510 structure.

