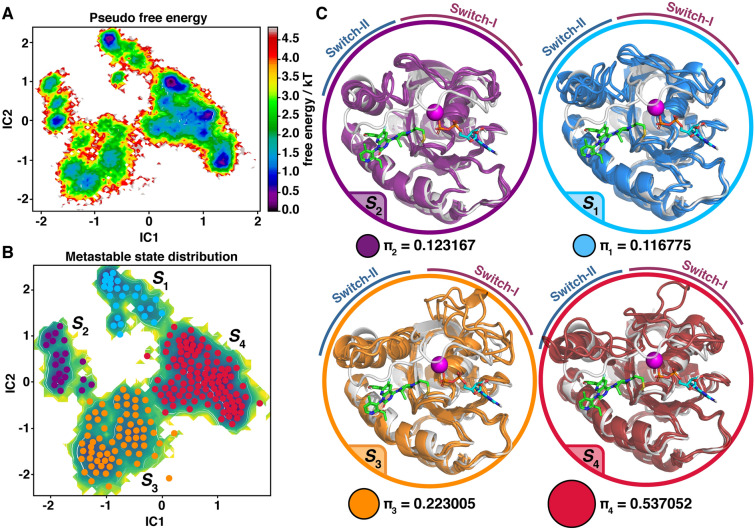
Figure 5.
Metastable states of KRAS(G12C)–AMG 510 complex revealed by Markov state modelling. (A) Pseudo free energy map of distributions along time-lagged independent components (ICs) 1 and 2. (B) Separation of four metastable states (S1–S4) by PCCA++ analysis. (C) Visualization of the metastable states. Each metastable state (Si) is illustrated with three representative structures (coloured cartoons) and the crystal structure conformation of KRAS(G12C)–AMG 510 complex is shown as a reference in grey. Equilibrium probability (πi) for each state is indicated below the conformations together with circles with an area that is relative to state probability.

