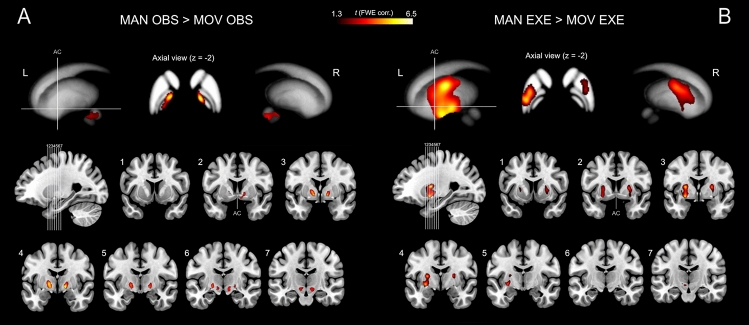
Figure 3.
Activations of basal ganglia and other subcortical structures related to the contrasts between experimental and control conditions (A) MAN_OBS > MOV_OBS and (B) MAN_EXE > MOV_EXE. Activation are shown on 3D basal ganglia template (ATAG, Atlas of the basal ganglia65; https://www.nitrc.org/projects/atag/; left view, right view and axial view) and seven parasagittal representative sections from ch2 template126 (MRIcron software; https://people.cas.sc.edu/rorden/mricron/index.html). AC = anterior commissure.

