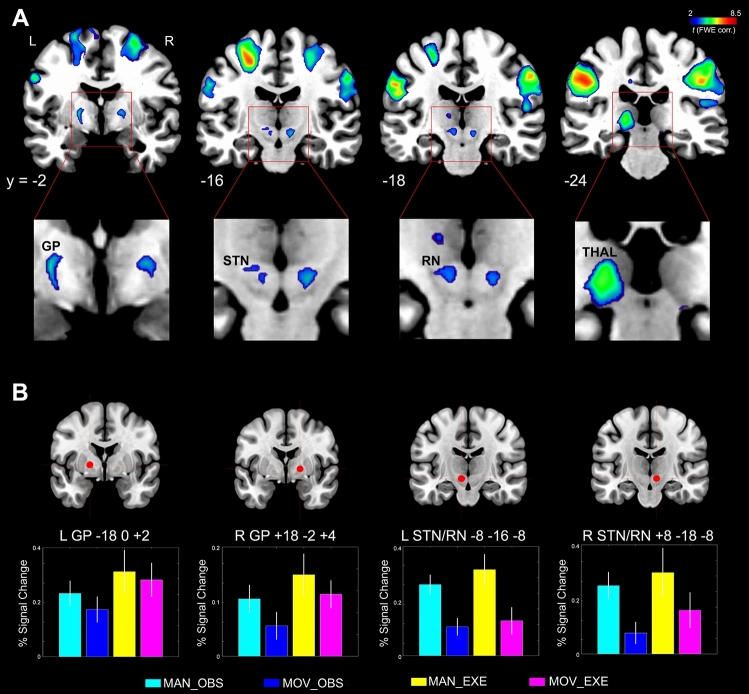
Figure 5.
(A) Statistical parametric map showing the results of the conjunction analysis between (MAN_OBS > MOV_OBS) AND (MAN_EXE > MOV_EXE) contrasts (subcortical structures). Shared activation voxels are rendered into 4 representative coronal slices (MRIcron software; https://people.cas.sc.edu/rorden/mricron/index.html). (B) Results of the ROI analysis in subcortical structures. The histograms show the averaged magnitude of activation (% signal change) in each ROI. Above each histogram the corresponding ROI is presented as red coloured sphere. Vertical lines in the histograms indicate standard error mean.

