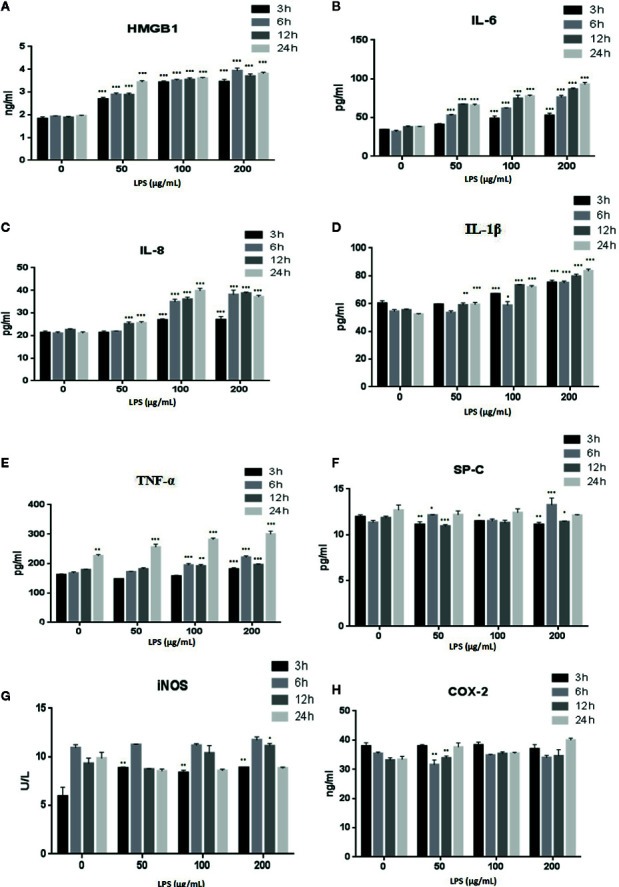
Figure 3.

LPS induced release of the inflammatory cytokines HMGB1 (A), IL-6 (B), IL-8 (C), IL-1β (D), TNF-α (E), SP-C (F), iNOS (G), and COX-2 (H) from A549 cells. *p < 0.05, **p < 0.01, and ***p < 0.001 compared with the control group. Graphs show the mean ± SD of triplicate wells and represent three independent experiments.
