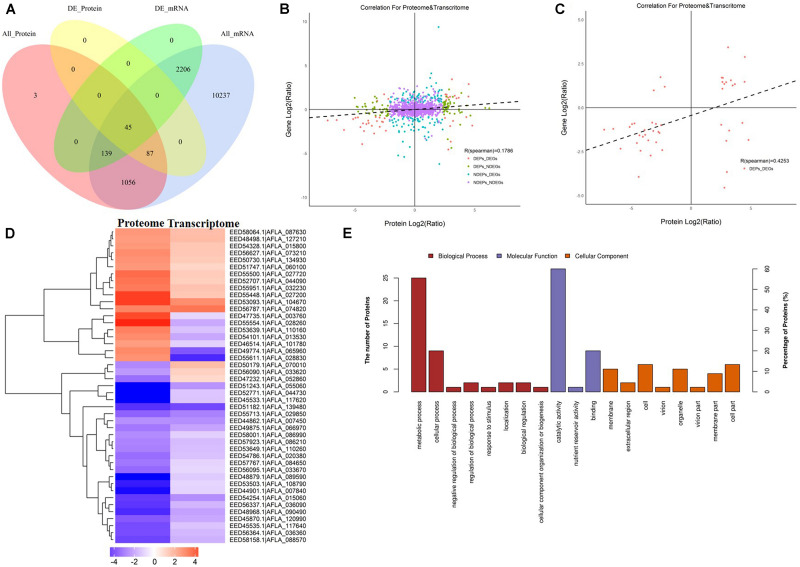
FIGURE 5.
The correlation analyses transcriptomes and proteomes of maize and peanut substrates. (A) The Venn diagram of the number of messenger RNAs (mRNAs) and proteins in comparison of maize and peanut substrates. All_Protein, DE_Protein, All_mRNA, and DE_mRNA stand for all quantifiable proteins, significantly different proteins, all quantifiable genes, and significantly different genes, respectively. (B) The scatter diagram of the correlation for all proteins and mRNAs. (C) The scatter diagram of the correlation for differentially expressed proteins (DEPs) and differentially expressed genes (DEGs). (D) Cluster analysis of correlated proteins/genes. Upregulated genes are shown in red, and downregulated genes are in blue. The different shades stand for the different change fold. (E) The GO annotation of the 45 correlated proteins/genes.

