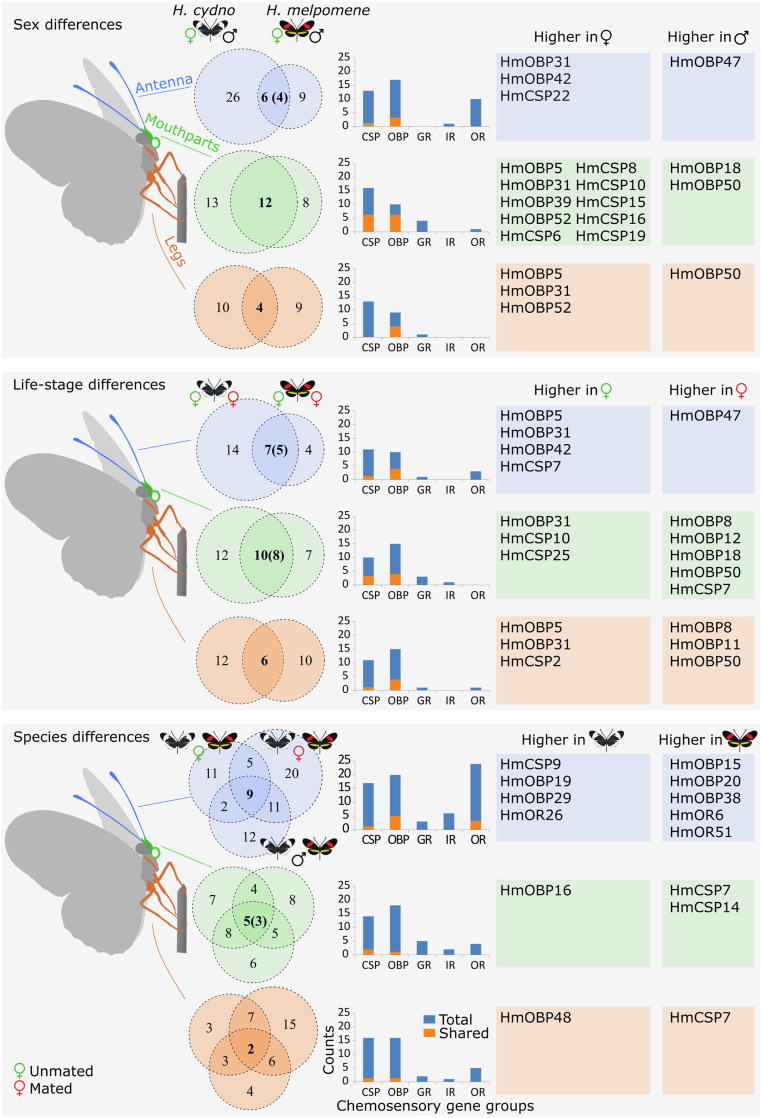
Fig. 2.
Overview of differentially expressed genes by tissue type, sex, life-stage, and species in H. cydno and H. melpomene. Venn diagrams show the number of genes differentially expressed and shared among comparisons (numbers between parentheses match the genes that are consistently differentially expressed in the same direction across sex, life-stage, or species). Bar plots indicate differentially expressed genes in each chemosensory gene family. The blue bars indicate the total gene count and the nested orange bars correspond to the genes in the overlap region of each respective Venn diagram. Tables on the right list the names of genes that are consistently differentially expressed in the same direction across sex, life-stage, or species; these match the overlap region of each respective Venn diagram.

