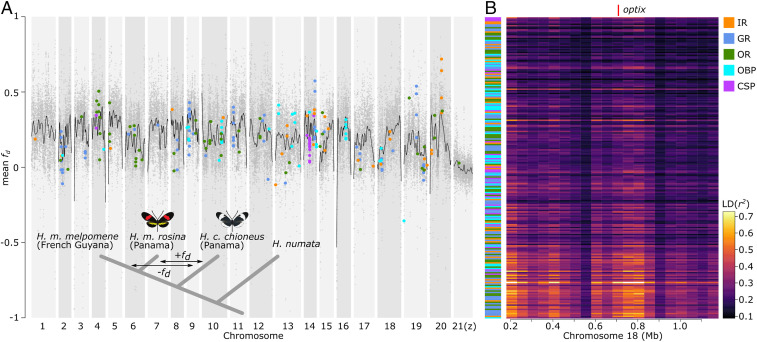
Fig. 3.
Genomic patterns of divergence between H. melpomene and H. cydno. (A) Per chromosome genomic patterns of admixture between H. cydno and H. melpomene (bottom left corner; population and relationships used in the admixture analysis). For all 21 chromosomes in the Heliconius genome (x axis), we show genome-wide admixture values (y axis; mean fd) calculated in 20-kb windows and per chromosome cubic splines (black lines). Chemosensory gene families are color-coded as indicated in the legend. (B) LD (r2) map of chemosensory genes and the color-pattern gene optix. On the y axis chemosensory gene families are color-coded as per the legend and ordered according to their fd value (highest fd at bottom). The x axis indicates a 1.2-Mb window around optix (red line) analyzed in 50-kb windows. For chemosensory gene names associated with B, see SI Appendix, Fig. S7 and Table S5.

