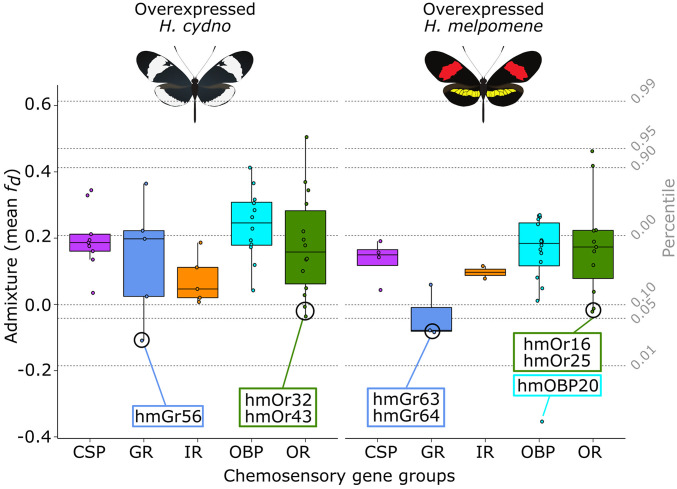
Fig. 4.
Admixture of chemosensory genes overexpressed in H. cydno and H. melpomene. Only chemosensory genes significantly overexpressed for each species are plotted. Admixture (y axis) is measured using a mean fd value was calculated from a 50-kb window around the transcription start site of each gene. Genes are considered to not show signals of admixture when fd ≥ 0; chemosensory genes with fd ≤ 0 are identified by their name. Mean genome fd and percentiles are indicated using dashed lines.

