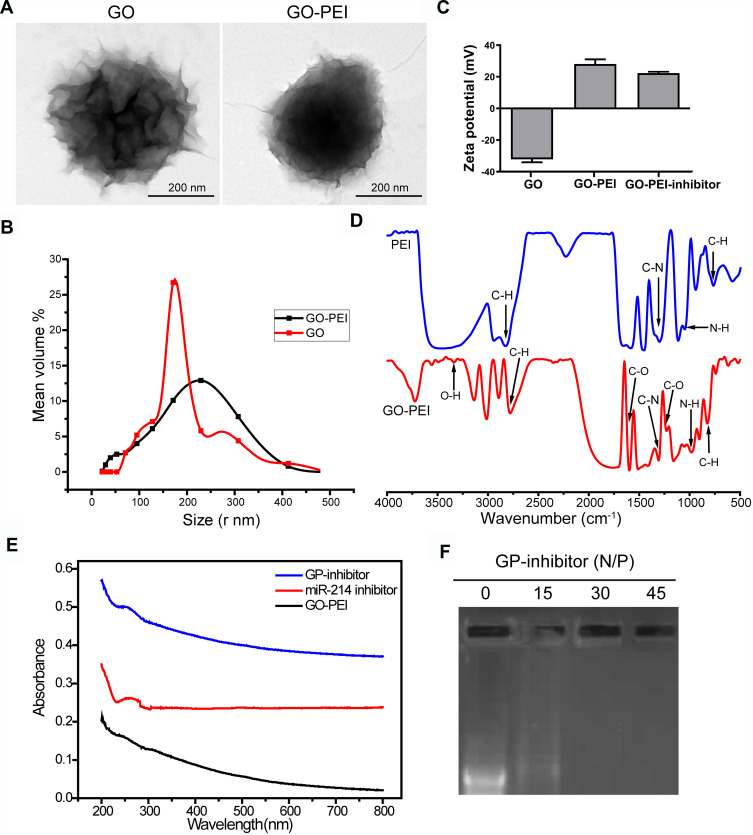
Figure 2.
Characterization of GO-PEI complexes. (A) SEM images of GO and GO-PEI complexes. Scale bars: 200 nm. (B) The size distributions of GO and GO-PEI were detected by DLS analysis. (C) Measurement of the zeta potential of GO and GO-PEI complexes. (D) FTIR spectra of PEI (top) and GO-PEI complexes (bottom). (E) UV-vis spectra normalized by their extinction coefficients at 260 nm. Blue line for GO-PEI-miR-214 inhibitor complex, red line for free miR-214 inhibitor sense strand, and dark line for GO-PEI; experiments were carried out in phosphate buffer (pH 7.4). (F) A gel retardation assay of the GP-inhibitor at different N/P ratios (0, 15, 30, 45).

