Figure 3.
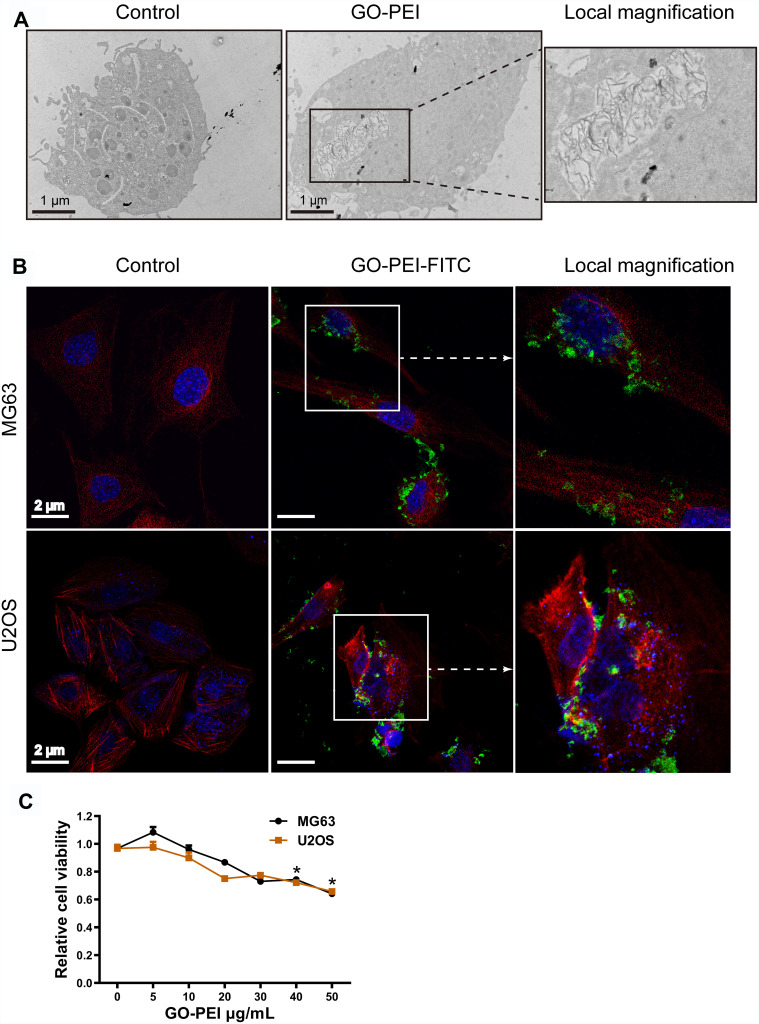
Uptake of GO-PEI into osteosarcoma cells. (A) TEM images of GO-PEI-incubated and non-incubated cells (3 μg/mL GO-PEI in the cell culture medium). The right panel is enlarged images of white squares in the image of GO-PEI-incubated cells. Scale bars: 1 μm. (B) FITC-BSA-labeled GO-PEI (green) is visualized in cells through confocal laser scanning microscopy. Fluorescence images of FITC-labeled GO-PEI (green) within MG63 and U2OS cells are shown. The cell cytoskeleton was stained with α-tubulin (red) for MG63 cells and rhodamine-phalloidin (red) for U2OS cells, and the nuclei were stained with DAPI (blue). The right panel is enlarged images of white squares in the image of GO-PEI-incubated cells. Scale bars: 2 μm. (C) Cell viability of MG63 and U2OS cells exposed to different concentrations of GO-PEI was measured by CCK8 assays. *p < 0.05.

