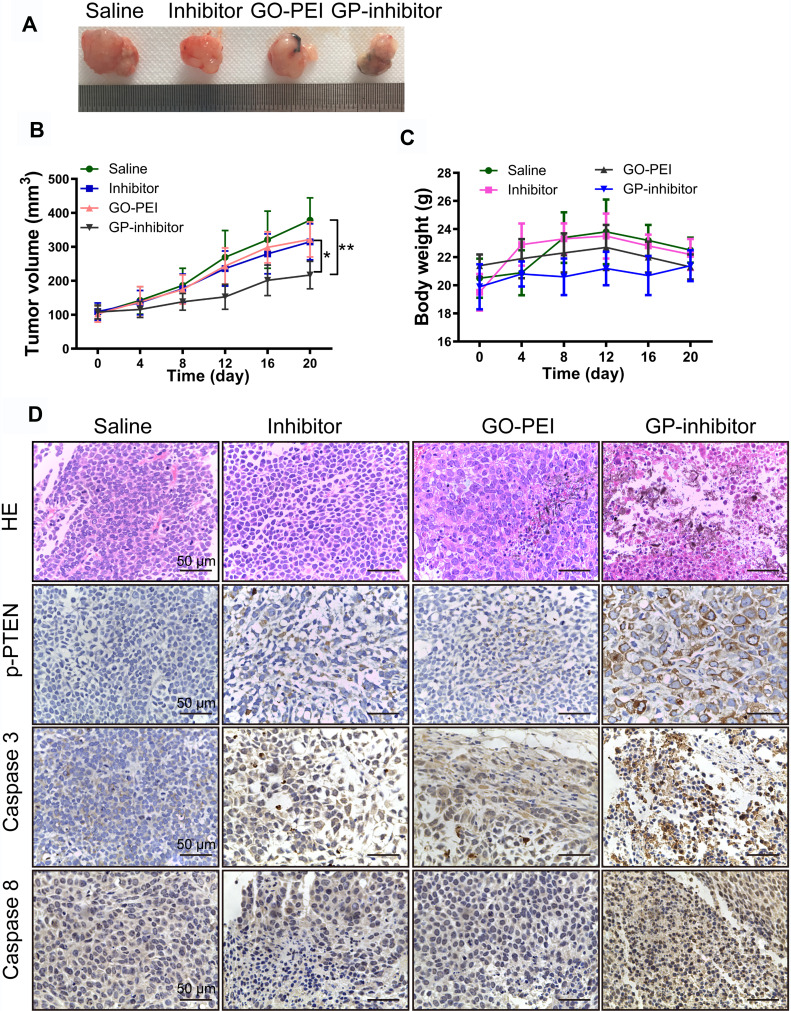
Figure 8.
Antitumor activities of GP-inhibitor in an MG63 xenograft mouse model. (A) Representative xenograft tumor tissue images of mice treated with saline, miR-214 inhibitor, GO-PEI or GP-inhibitor complexes (30 μL). (B) Relative changes of tumor volume over time. The values are presented; n=5. (C) Relative changes of body weight over time and the values are presented; n=5. (D) Representative images of HE staining and immunohistochemical staining of PTEN, caspase 3 and caspase 8 in different treatment groups are shown. Scale bars: 50 μm. *p < 0.05; **p < 0.01.

