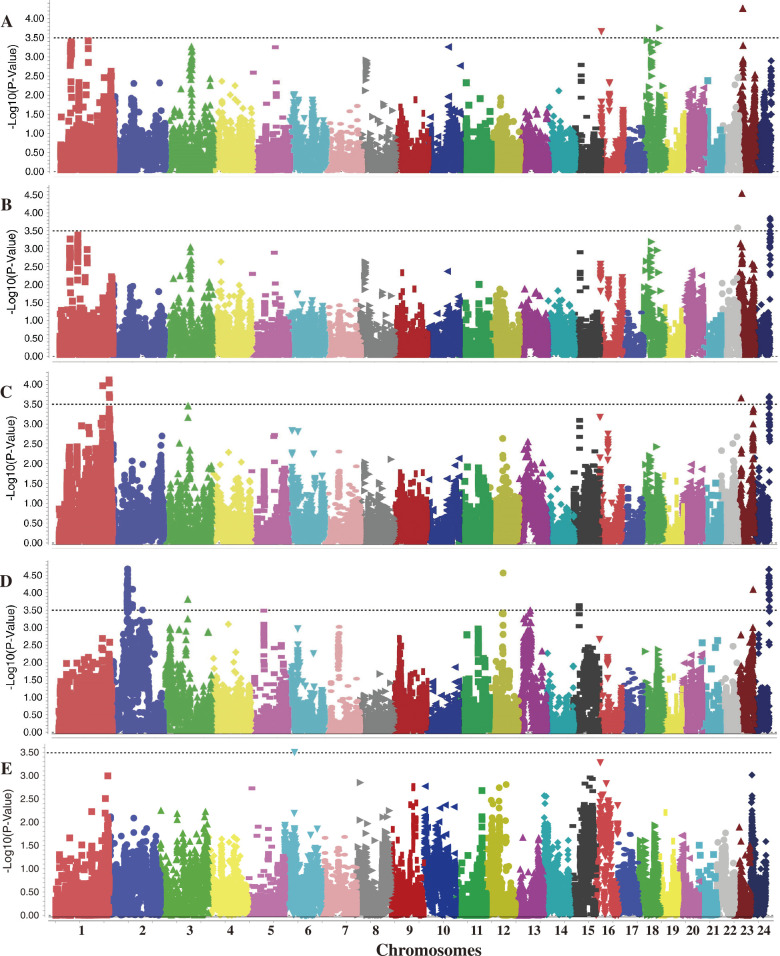
Fig. 3.
Manhattan plots of genome-wide association study of the five leaf chemistry traits with 3,301 SNPs shown as dot plots of MLM_Q + K at P < 3.03E-4 in best unbiased predictions (BLUPs) across all environments. A–E, indicates total sugar (TS), reducing sugar (RS), total nitrogen (TN), nicotine (NIC), and total potassium (TP) contents, respectively.

