Figure 1.
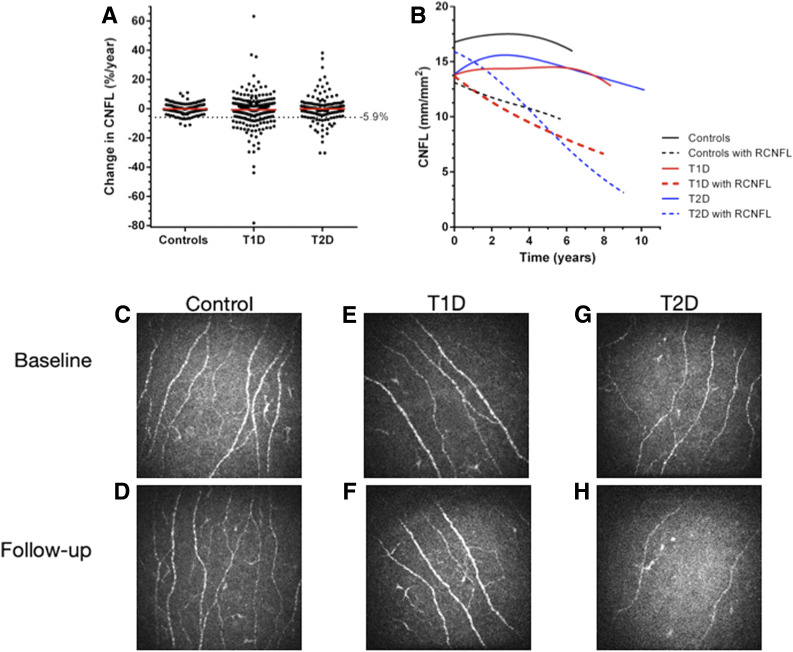
Annual change in CNFL and representative images. A: The threshold for RCNFL (−5.9%) was determined by the 5th percentile of control patients without diabetes. There was a higher incidence of RCNFL in the diabetes groups compared with control patients without diabetes (P < 0.001). Two outliers beyond 80% change in the control and T1D group are not shown. The red line indicates the mean change in each group. B: Change in CNFL from baseline to follow-up is shown for participants with and without RCNFL, displayed using spline curves. Change in CNFL from baseline to follow-up was as follows: control participants without diabetes 0.17 ± 2.69 mm/mm2; control participants without diabetes with RCNFL −2.00 ± 3.56 mm/mm2; T1D 0.60 ± 2.49 mm/mm2; T1D with RCNFL −4.41 ± 2.50 mm/mm2; T2D 0.81 ± 2.94 mm/mm2; T2D with RCNFL −4.97 ± 2.11 mm/mm2. C and D: Images of control participants without diabetes at baseline (CNFL 17.8 mm/mm2) and with stable CNFL at 2 years follow-up (CNFL 17.9 mm/mm2, slope 0.3% per year). E and F: A participant with T1D with no DSP at baseline (CNFL 13.4 mm/mm2) or 6 years follow-up (CNFL 12.1 mm/mm2, slope −1.6% per year). G and H: A participant with T2D (CNFL 14.3 mm/mm2) who had RCNFL and developed DSP over 5 years of follow-up (CNFL 5.6 mm/mm2, slope −12.6% per year).

