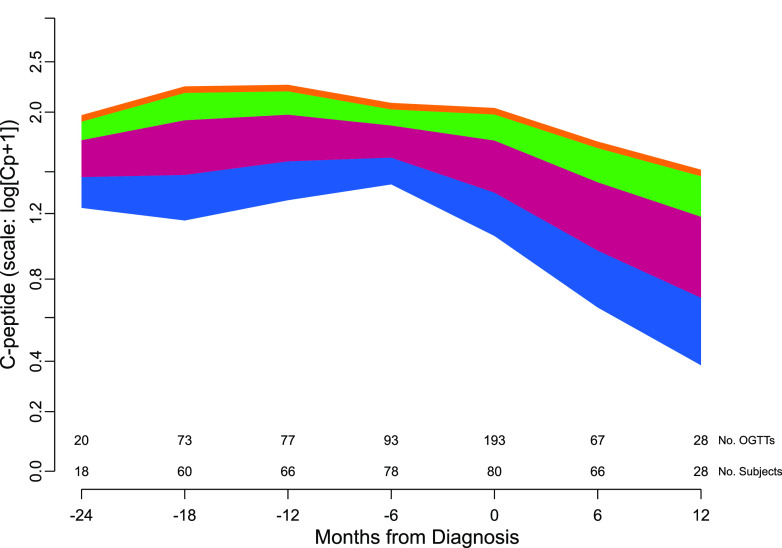
Figure 2.
The mean rate of C-peptide decline before and after type 1 diabetes diagnosis from the fitted mixed model in which age is included as a continuous variable. Four age ranges are used to illustrate the effect of age on C-peptide decline: blue = ages 6–11; burgundy = ages 11–17; green = ages 17–20; and orange = age >20 years. The number of subjects and the number of C-peptide measurements contributing to the fit are displayed along the x-axis. The frequency is based on the points within a ±3-month window of the month indicated under the tick mark.

