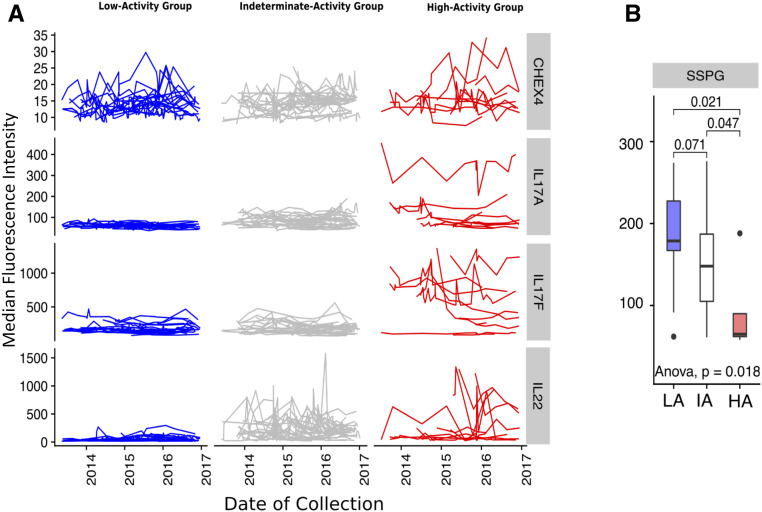
Figure 1.
Participants grouped according to IL-17/IL-22 cytokines. A: Gaussian mixture modeling of cytokine mean abundance and variance separates study participants into three discrete groups (columns). Lines within each panel represent repeated measurements of serum cytokine abundance for one individual over the study period. Rows represent serum cytokines (IL-17A, IL-17F, IL-22). CHEX4 is a measurement of background fluorescence intensity and can be treated as a negative control. (Note: different scales on y-axis for each row.) B: SSPG (mg/dL) measurement by group. P values for pairwise Wilcoxon test are labeled above the bar plot, and the P value for a one-way ANOVA test is labeled under the bar plot. The analysis in A was based on 297, 371, and 112 repeated measurements for HA, IA, and LA subjects, respectively.

