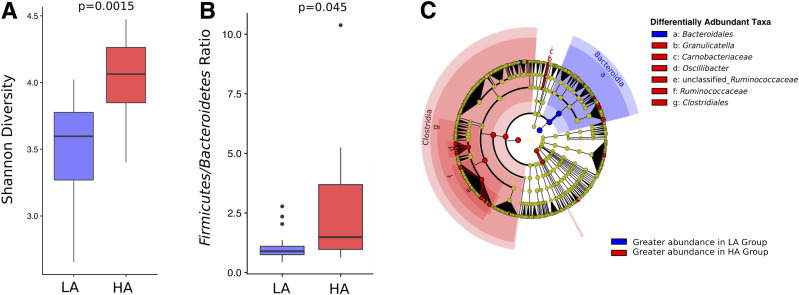
Figure 3.
Differences in the gut microbiome of IL-17/IL-22 LA and HA subjects. A: Shannon diversity estimates for the HA and LA. Mean value of diversity for each participant across the study period is used to generate this plot. The P value from a Wilcoxon test is labeled above the plot. B: Firmicutes-to-Bacteroidetes ratio of HA and LA. Mean value of Firmicutes-to-Bacteroidetes ratio for each participant across the study period is used to generate this plot. The P value from a Wilcoxon test is labeled above the plot. C: Cladogram representing the LEfSe results for comparing taxa abundance between HA and LA groups. Circles on the cladogram represent the phylogenetic relationship of taxa that are tested, with phylum at the center and operational taxonomic unit (OTU) on the edges. Each point represents a taxonomic unit. Red color covering a dot/region indicates the taxa that are more abundant in the HA group, and blue color covering a dot/area indicates the taxa are more abundant in the LA group.

