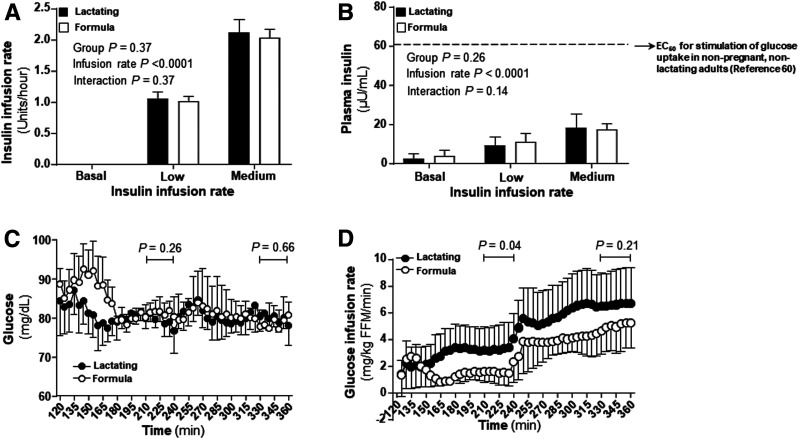
Figure 2.
Insulin infusion rate, insulin and glucose concentrations, and glucose infusion rate. A: Insulin infusion rates, insulin and glucose concentrations, and glucose infusion rates. B: Insulin concentrations during the clamp compared with literature values (denoted by the top dashed line) for the mean insulin concentration that will half maximally stimulate glucose uptake in nonpregnant, nonlactating adults (60). C: Glucose concentrations during the clamp. D: Glucose infusion rates during the clamp. Data are mean ± SD. Filled bars and filled circles represent lactating women. Open bars and open circles represent formula-feeding women.

