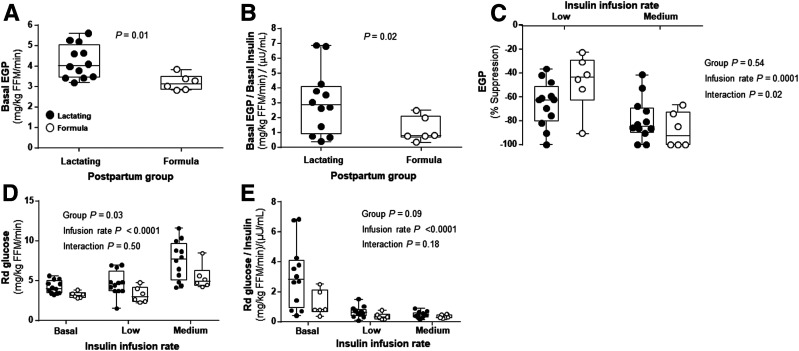
Figure 3.
EGP, EGP suppression, and whole-body glucose disposal. A: Basal EGP without adjustment for basal insulin concentration. B: Basal EGP with adjustment for basal insulin concentration. C: EGP suppression. D: Rd glucose without normalization for insulin concentrations at basal state and at low and medium insulin infusion rates. E: Rd glucose with normalization for insulin concentrations at basal state and at low and medium insulin infusion rates. Data are mean ± SD for lactating (n = 12, filled circles) and formula-feeding (n = 6, open circles) women.

