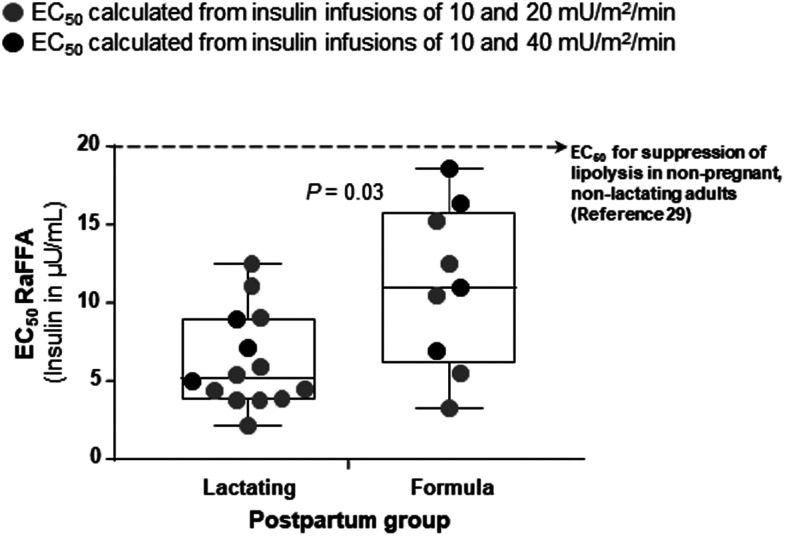
Figure 5.
Insulin concentration EC50 for half maximal suppression of RaFFA. Data represent the EC50 RaFFA. Each gray-filled symbol represents datum from a lactating or formula-feeding woman who underwent the two-step hyperinsulinemic-euglycemic clamp at low and medium insulin levels (10 and 20 mU/m2/min, respectively). Only 16 of the 18 subjects are reported in the main analysis because 2 subjects did not reach 50% suppression of RaFFA with the medium-dose infusion. To increase the sample size and to determine whether the choice of clamp protocol insulin levels influenced the calculated EC50 RaFFA, an additional group of lactating and formula-feeding women (black-filled symbols) underwent an insulin infusion at 10 and 40 mU/m2/min insulin. Only 7 of the 10 subjects are reported from this additional group because 2 did not receive isotopes and 1 did not reach 50% suppression of RaFFA with the high-dose infusion. The box and whiskers graph represent minimum, maximum, median, and 25th and 75th percentiles. Lastly, the horizontal dotted line represents data from a published study (29) in nonpregnant, nonlactating women for comparison. In that study, the EC50 was calculated from a two-step clamp using insulin infusions of 0.25 and 2.5 mU/kg FFM/min (equivalent to 6 and 60 mU/m2/min when put in the units used in present study).

