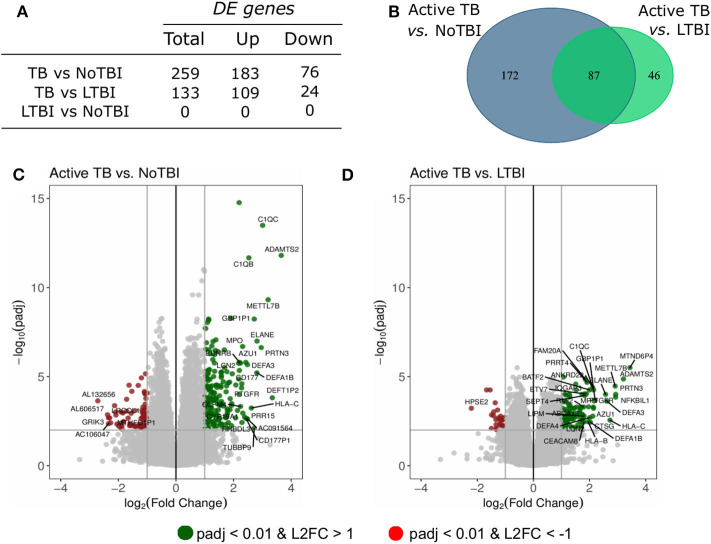
Figure 1.
Summary of the differentially expressed (DE) genes in the pairwise contrasts comparing the TB study groups. (A) Total number of DE genes (adjusted p < 0.01 and absolute Log2 Fold Change (L2FC) >1) and number of up- or down-regulated genes. (B) Venn diagram with the overlapping genes between the different signatures. The volcano plots highlight the genes with significant differences between (C) active TB patients vs. uninfected (NoTBI) contacts and (D) active TB patients vs. contacts with latent infection (LTBI). The Top-30 most modulated (genes with the greatest absolute fold change) genes were labeled.

