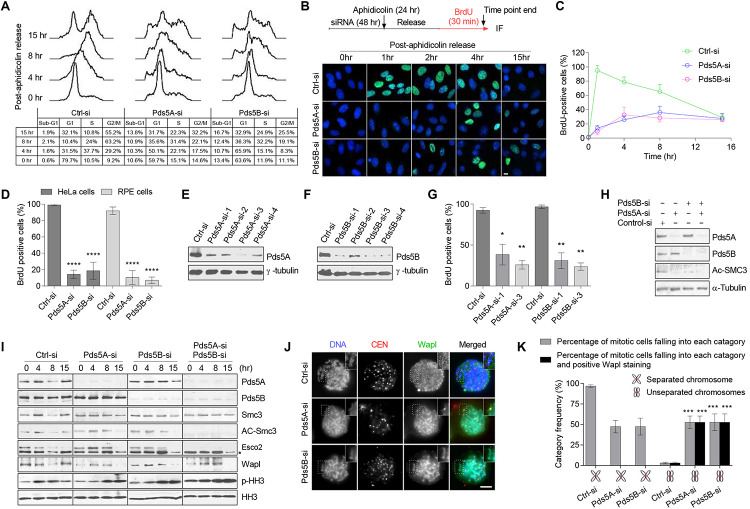
FIGURE 2.
Pds5A and Pds5B have overlapping functions in S-phase but distinct roles in mitosis. (A) FACS analysis of Pds5-depleted HeLa cells at the indicated time points following release from G1/S-phase arrest. (B) The experimental scheme is shown (top). Immunofluorescence images of Pds5-depleted HeLa cells labeled with BrdU for 30 min before the end of the indicated time point after release from G1/S-phase arrest. DNA was stained with Hoechst 33342 (blue). Scale bar: 10 μm. (C) Graph showing quantitation of the data shown in (B). At least 100 cells were counted in randomly selected fields. Each point represents the mean ± SEM of three independent experiments. (D) Histogram showing the percentage of BrdU-positive cells. Exponentially growing HeLa and RPE cells were labeled with BrdU for 30 min after 48 h from transfection with 50 nM control-si, Pds5A-si, or Pds5B-si. At least 100 cells were counted in randomly selected fields. Data represent the mean ± SEM of three independent experiments: ****p < 0.0001. P-values were calculated using two-way ANOVA. (E,F) HeLa cells were separately transfected with individual siRNAs directed against Pds5A or Pds5B for 48 h. Total cell extracts were prepared and subjected to immunoblotting analysis using antibodies against the indicated proteins. (G) Histogram showing the percentage of BrdU-positive cells following individual siRNAs treatment. Mean values ± SD of measurements are from at least 100 cells from three independent experiments: *p < 0.05; **p < 0.01. P-values were calculated using two-way ANOVA. (H) Reduction of Ac-Smc3 was determined by immunoblotting analysis of total cell lysates prepared from HeLa cells after depletion of Pds5 proteins. (I) Immunoblotting analysis of chromatin-associated protein fractions was prepared from synchronized HeLa cells at the G1/S-phase with aphidicolin for 24 h after depletion of Pds5A, Pds5B, and both. Phospho-histone H3 (PHH3) was used as a marker for mitosis. Asterisk indicates a nonspecific band. (J) Representative immunofluorescence microscopy images showing the distribution of Wapl in HeLa cells arrested at mitosis with 10 μM Taxol after depletion of Pds5A or Pds5B by siRNA; enlarged images are shown in the insets. Scale bar: 8 μm. (K) Histogram indicating the frequency of Wapl localization along unresolved chromosome arms after depletion of Pds5A or Pds5B. Mean values ± SD of measurements from at least 100 cells from three independent experiments: ***p < 0.001. P values were calculated using two-way ANOVA.

