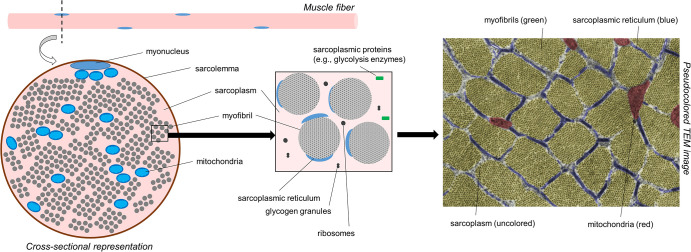
FIGURE 1.
A simplified schematic of muscle fiber morphology. The left inset is a recreated figure of what would be observed under a TEM if tissue were prepared for cross-sectional imaging. The right inset image is a pseudocolored cross-sectional TEM image within the skeletal muscle fiber of a Wistar rat showing different cellular components (15,000×). Notably, much of the attention in this figure is devoted to myofibrils. However, it is also important to note that mitochondria make up ∼5% of the muscle cell area in cross section. The image was licensed from sciencesource.com (courtesy of Jose Luis Calvo) by the authors for scientific publication purposes.

