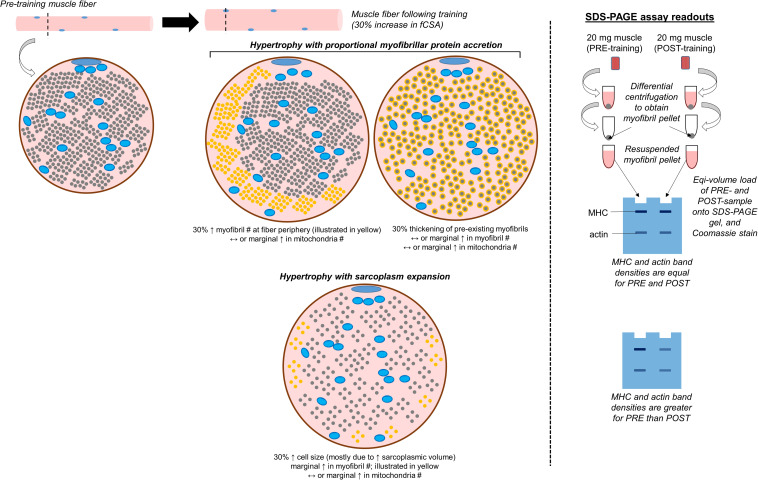
FIGURE 3.
Conceptualization of conventional versus sarcoplasmic hypertrophy, and how these phenomena would manifest with the electrophoresis technique discussed. The left inset demonstrates various modes of muscle fiber hypertrophy. The small blue circles within the fiber represent mitochondria, the smaller gray circles occupying most of the intracellular space represent myofibrils, and the remainder of the space represents the sarcoplasm. In situations where hypertrophy occurs due to the proportional accretion of myofibrillar protein (i.e., conventional hypertrophy), there could either be the addition of new myofibrils to the periphery which “push” the cell outward (indicated as new yellow dots), or there could be the thickening of pre-existing myofibrils (indicated by the haloing of gray circles). Alternatively, sarcoplasmic hypertrophy occurs through the disproportionate expansion of the sarcoplasm relative to myofibril addition. Select studies have shown this process may occur in response to resistance training, although some studies refute this model of hypertrophy. This process could potentially be shown through TEM imaging, phalloidin staining, or the determination of specific tension in isolated fibers (not depicted in figure). This process could also be reflected when analyzing pre- and post-training biopsy specimens through SDS-PAGE and Coomassie staining, and analyzing the changes in myosin heavy chain (MHC) and actin protein band densities (illustrated on the right inset of the figure).

