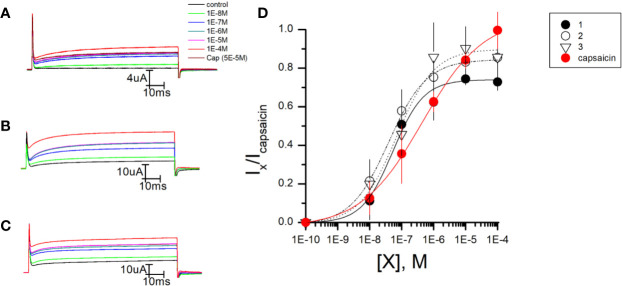
Figure 2.
In vitro evaluation of putative TRPV1 agonists. (A) Representative experiments of TEVC recordings in Xenopus Oocytes expressing TRPV1 channels during a +30 mV pulse at increasing concentrations of compounds 1 (A), 2 (B), and 3 (C). (D) Dose–response curve of putative TRPV1 agonists. Steady-state currents elicited by a voltage pulse at +30 mV in the presence of compound 1 (filled circles), compound 2 (empty circles), compound 3 (inverted triangles), and capsaicin (red circles) normalized by the currents elicited in the presence of capsaicin (Ix/Icapsaicin) as a function of capsaicin or test compound concentration (X). The data was fitted using Hill Equation: . The following parameters were estimated for compounds 1, 2, 3, and capsaicin: EC50 of 53 ± 6 nM, 53 ± 4.3 nM, 92 ± 10 nM, and 440 ± 66 nM respectively; Hill coefficients (n) of 0.73, 0.9, 1.06, and 0.45 respectively and maximal effect was 0.8, 0.73, 0.89, and 1, respectively.

