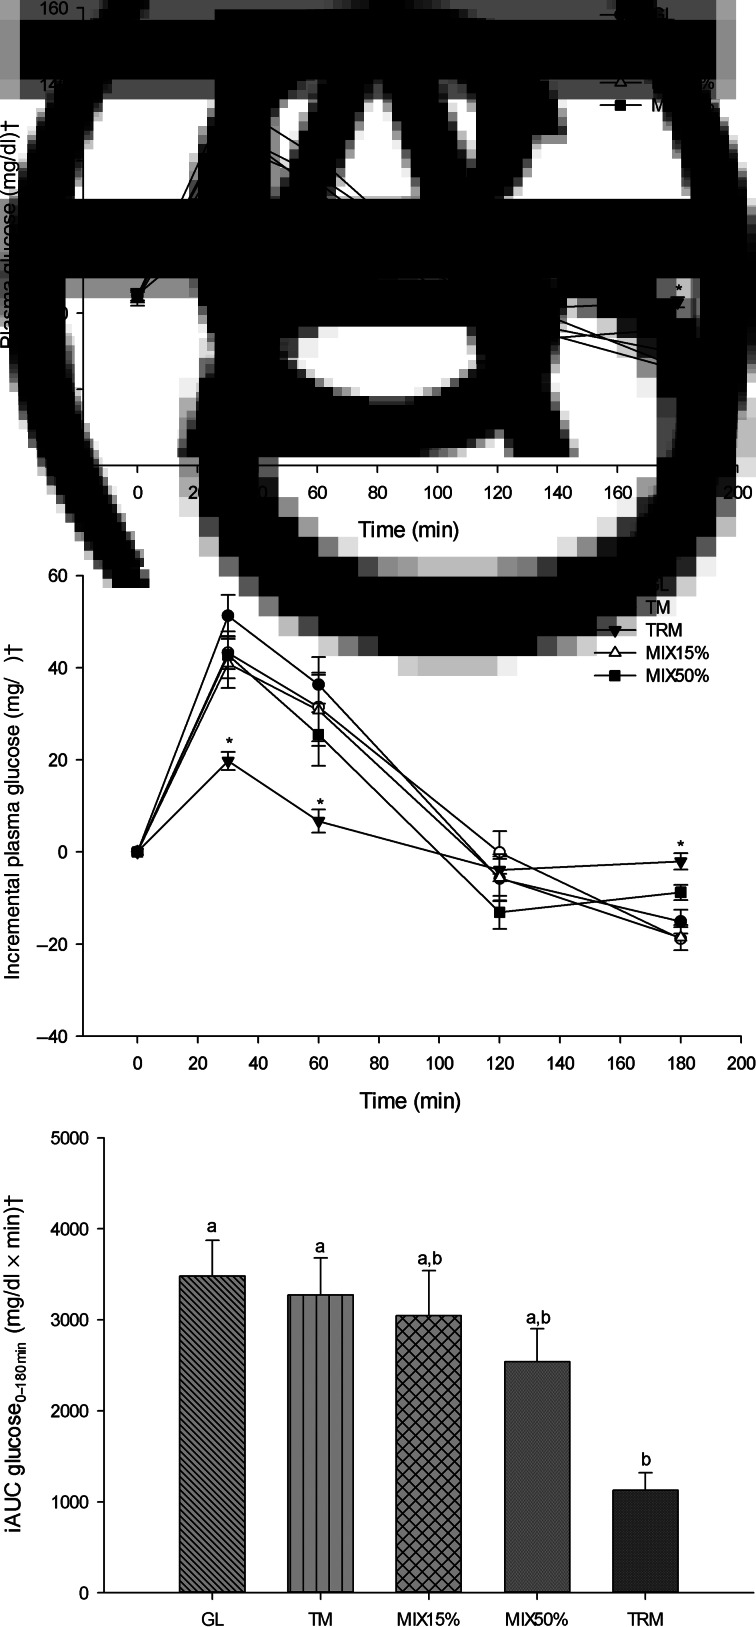
Fig. 2.
Glycaemic responses following 50 g of starch ingestion in healthy participants (n 16): 50 g glucose (GL); 50 g tapioca maltodextrin (TM); 50 g tapioca resistant maltodextrin (TRM); 42⋅5 g TM (85 %) + 7⋅5 g TRM (15 %) (MIX15%); and 25 g TM (50 %) + 25 g TRM (50 %) (MIX50%). (A) Plasma glucose over 180 min (mg/dl), (B) incremental plasma glucose over 180 min (mg/dl), and (C) incremental AUC (iAUC) of glucose from 0 to 180 min (iAUC glucose0–180min). Values are means, with their standard errors represented by vertical bars. * Mean value was significantly different from that for GL (P < 0⋅05). a,b Mean values with unlike letters were significantly different (P < 0⋅05). † To convert glucose in mg/dl to mmol/l, multiply by 0⋅0555.

