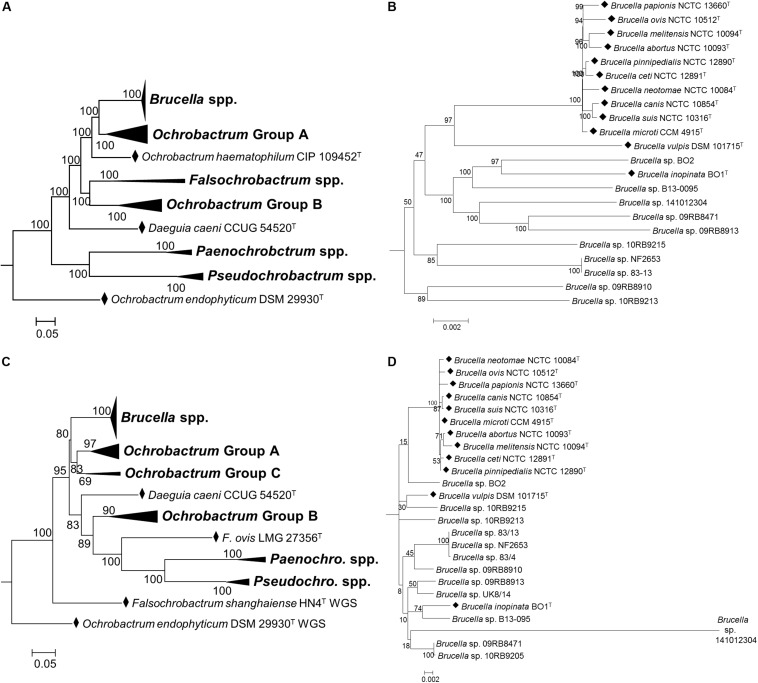
FIGURE 4.
Phylogenetic relationship between type strains of the family Brucellaceae (and selected atypical Brucella sp. strains), based on WGS (A,B) and MLSA (C,D). Panels (A,C) show the phylogeny inferred for the entire family, whilst panels (B,D) show only the Brucella spp. clade. Type strains are denoted by a black diamond (◆). In both cases the evolutionary history was inferred using the maximum likelihood method, based on the general time reversible model. Node labels give percentage bootstrap support. The scale bar shows the number of base substitutions per site. Rhizobium etli (CFN42T) was used to root the phylogenetic tree (not shown).

