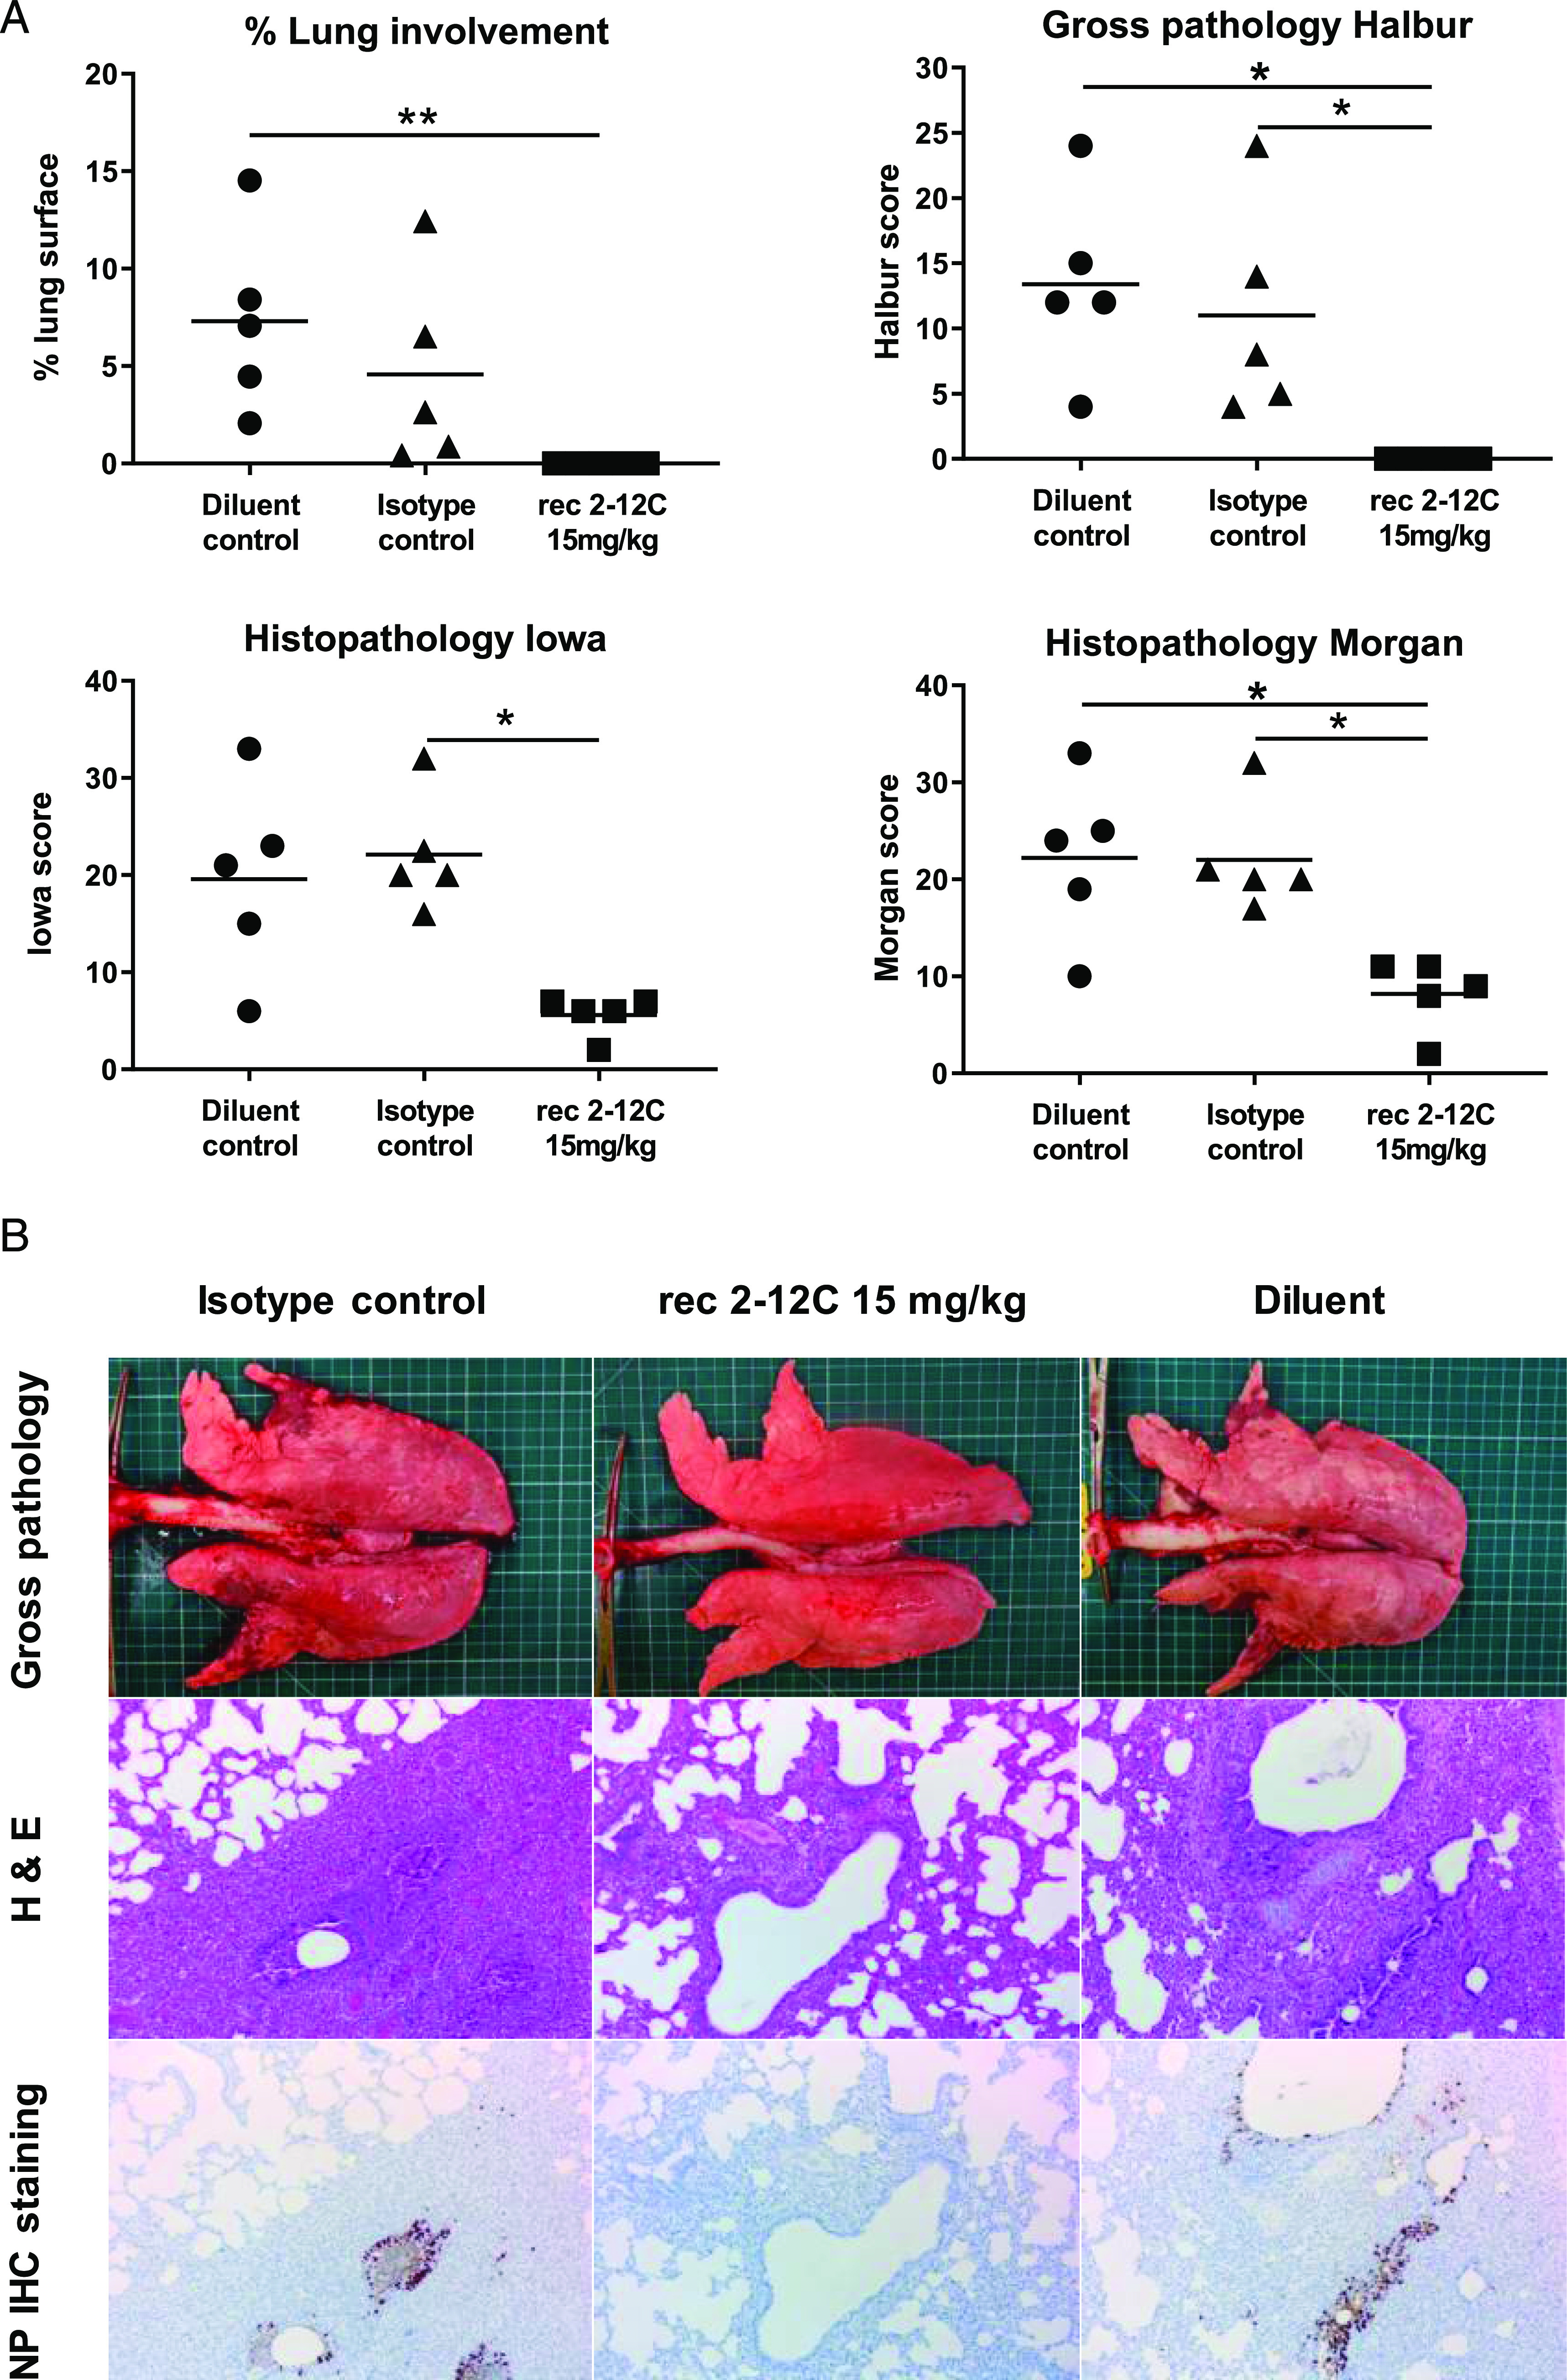
FIGURE 2.

Lung pathology. Abs or diluent were administered i.v. to pigs, which were infected with pH1N1 virus 24 h later. The animals were culled at 4 DPI, and lungs were scored for appearance of gross and histopathological lesions. The score for each individual in a group and the group means are shown (A). Representative gross pathology, histopathology (H&E staining; original magnification ×100), and immunohistochemical NP staining (original magnification ×200) for each group are shown (B). Pathology scores were analyzed using one-way nonparametric ANOVA with the Kruskal–Wallis test. Asterisks denote significant differences *p < 0.05, **p < 0.01, versus indicated control groups.
