
FIGURE 4.
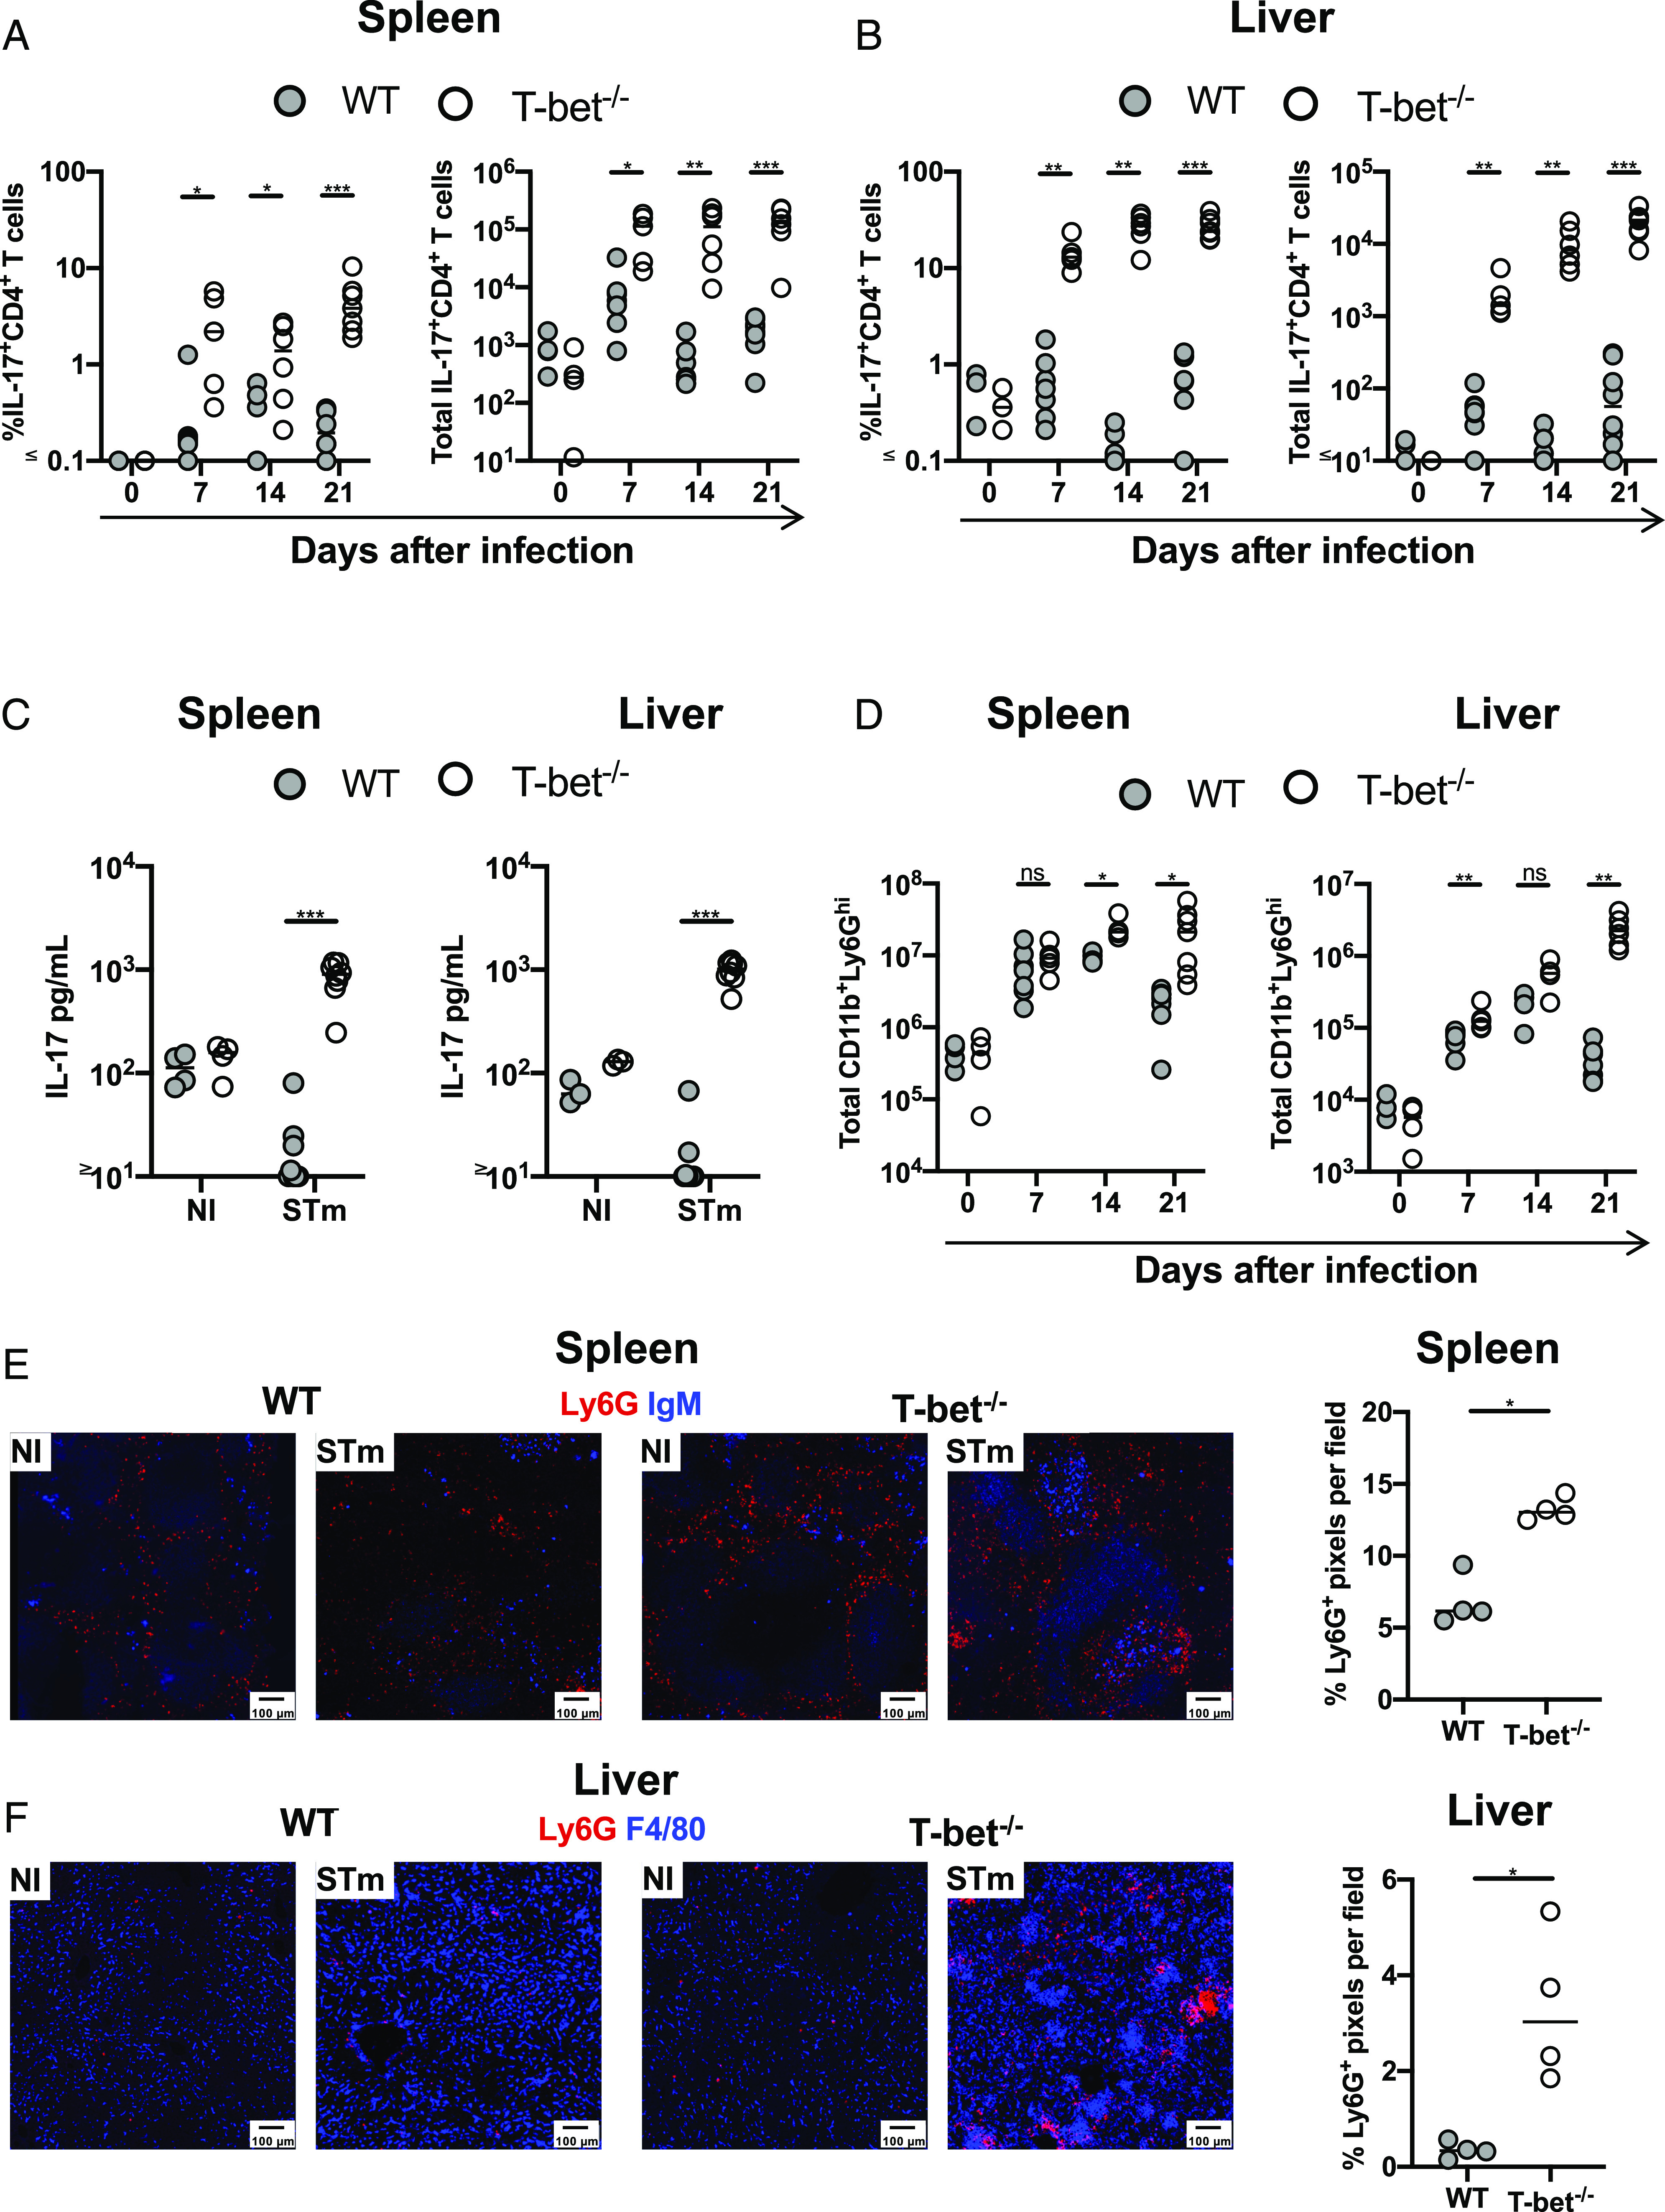
Th17 responses are enhanced in T-bet−/− mice after STm infection. Frequency and total numbers of IL-17+CD62L−CD4+ T cells in (A) spleens and (B) livers from mice infected with STm. (C) Quantification of IL-17A in supernatants from cells obtained from spleens and livers 21 d postinfection. (D) Total numbers of CD11b+Ly6Ghi (neutrophils) in spleens and livers at different times postinfection. (E) Representative immunofluorescence micrographs of a spleen (E) and liver (F) from WT and T-bet−/− mice that were noninfected or infected for 21 d. Graphs show the percentage of Ly6G pixels detected per field. Spleen sections stained with anti-Ly6G (red) and anti-IgM (blue) and livers with anti-Ly6G (red) and anti-F4/80 (blue). Each point represents a value for the tissue of a single mouse, and bars show the median value. Data combined from at least two independent experiments with three to five mice per group. Mann–Whitney U test was applied in (A), (B), and (D). Nonparametric two-way ANOVA with Tukey post hoc test was applied in (C). *p < 0.05, **p < 0.01, ***p < 0.001. ns, nonsignificant.