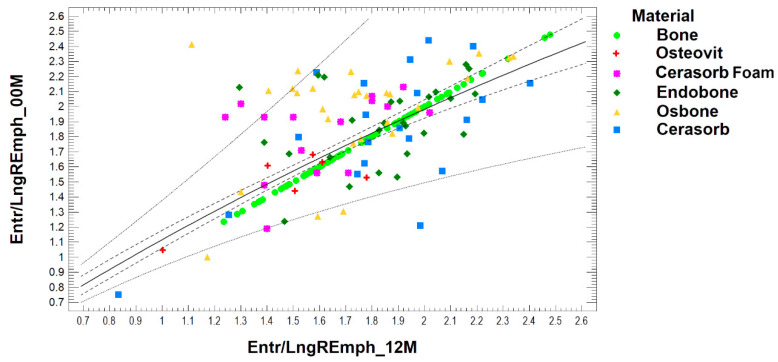
Figure 4.
Dependence of the observed radiological texture at the site of biomaterial implantation created after twelve months of healing on the appearance of the radiological image of the recent biomaterial implanted. Simple regression plot calculated for all collected data. Note: solid line—regression plot; dotted line—prediction limits; dash line—confidence limit for p < 0.05.

