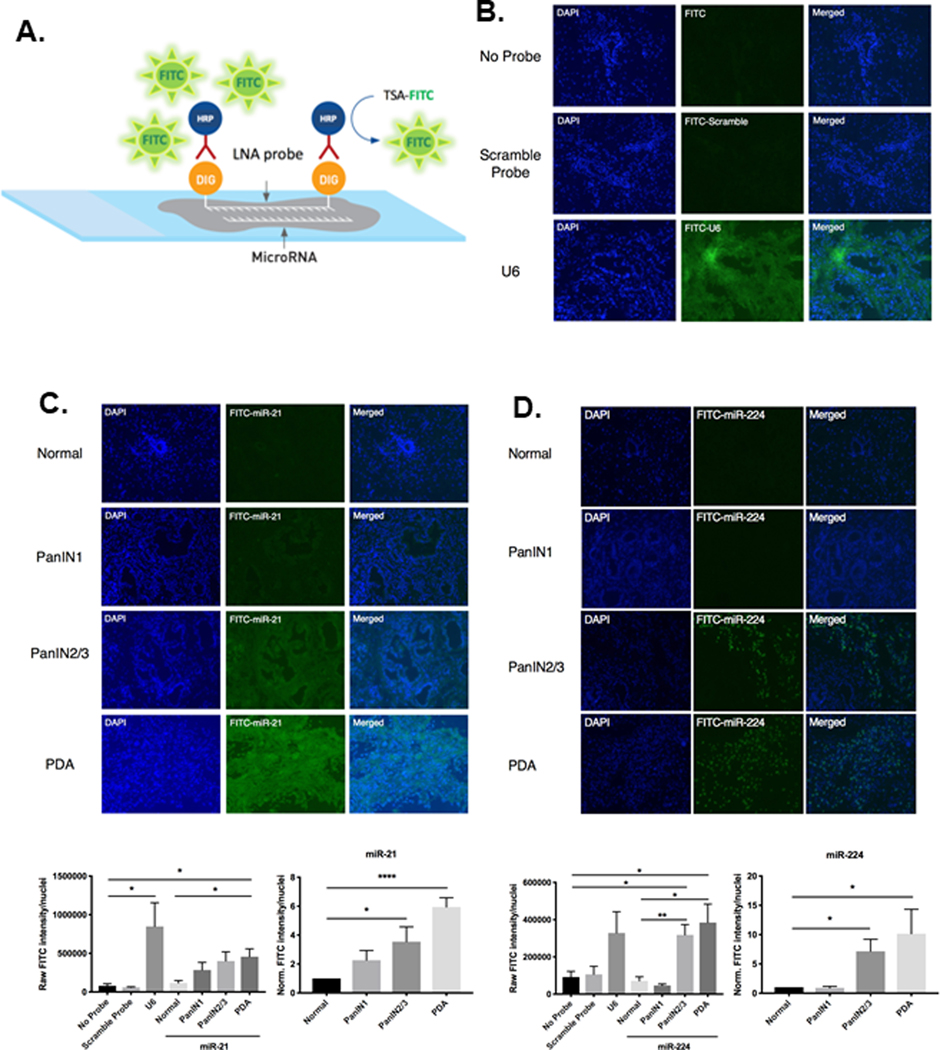
Figure 1. miR-FISH analysis quantifies endogenous spatial-temporal expression of miR-21 and miR-224 throughout premalignant progression.
A. Schematic of miR-FISH, which detects endogenous miRNA in tissue sections. B. Representative fluorescent images of sections of pancreas stained with either no probe, non-specific scramble-miRNA probe, or U6 positive control probe. No fluorescent signal was observed with no probe or scramble-miRNA probe staining, however strong ubiquitous fluorescent signal was observed upon staining with U6 positive control probe. C. Representative fluorescent images of normal ducts, increasing grades of PanIN lesions, and PDA tissue stained with miR-21. Expression of miR-21 is concentrated in ductal epithelial cells. Displayed below is the quantified image analysis of miR-21 fluorescent signal. D. Representative fluorescent images of normal ducts, increasing grades of PanIN lesions, and PDA tissue stained with miR-224. Expression of miR-224 is concentrated in the stromal compartment surrounding high-grade PanIN2/3 lesions and PDA. Below is the quantified image analysis of miR-224 fluorescent signal. Raw fluorescent signals were quantified by FITC intensity/nuclei. PanIN1, PanIN2/3, and PDA raw signals were normalized to that of normal pancreatic ducts of WT C57BL/6 mice to generate relative signal intensities. (n=4–6 experiments).

