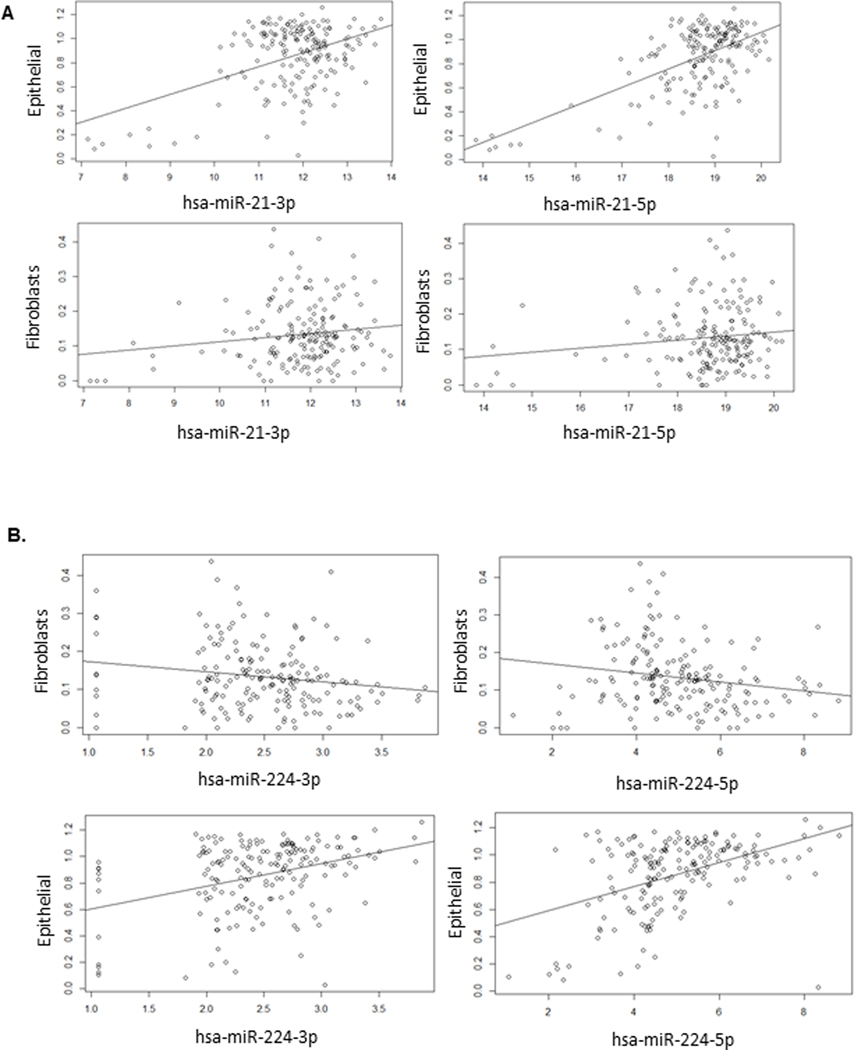
Figure 6. Analysis from TCGA examines miR expression with tumor cellular content.
The PDA cohort of TCGA was used to correlate miR expression in relation to tumor cellular composition estimated from computational microdissection with xCell. A. miR-21 expression is significantly associated with tumor epithelial cell content. P-value for epithelial cell content for hsa-miR-21–3p= 8.7e-7; hsa-miR-21–5p = 2.1e-13. There is not a significant association between miR-21 expression and tumor fibroblast content. B. miR-224 expression is inversely associated with tumor fibroblast content and associated with epithelial cell content. P-value for fibroblast content for hsa-224–3p = 0.022; hsa-224–5p = 0.00015. P-value for epithelial content for hsa-224–3p = 2.0e-5; hsa-224–5p = 0.00021. Plotted miR expression values are variance stabilized.

