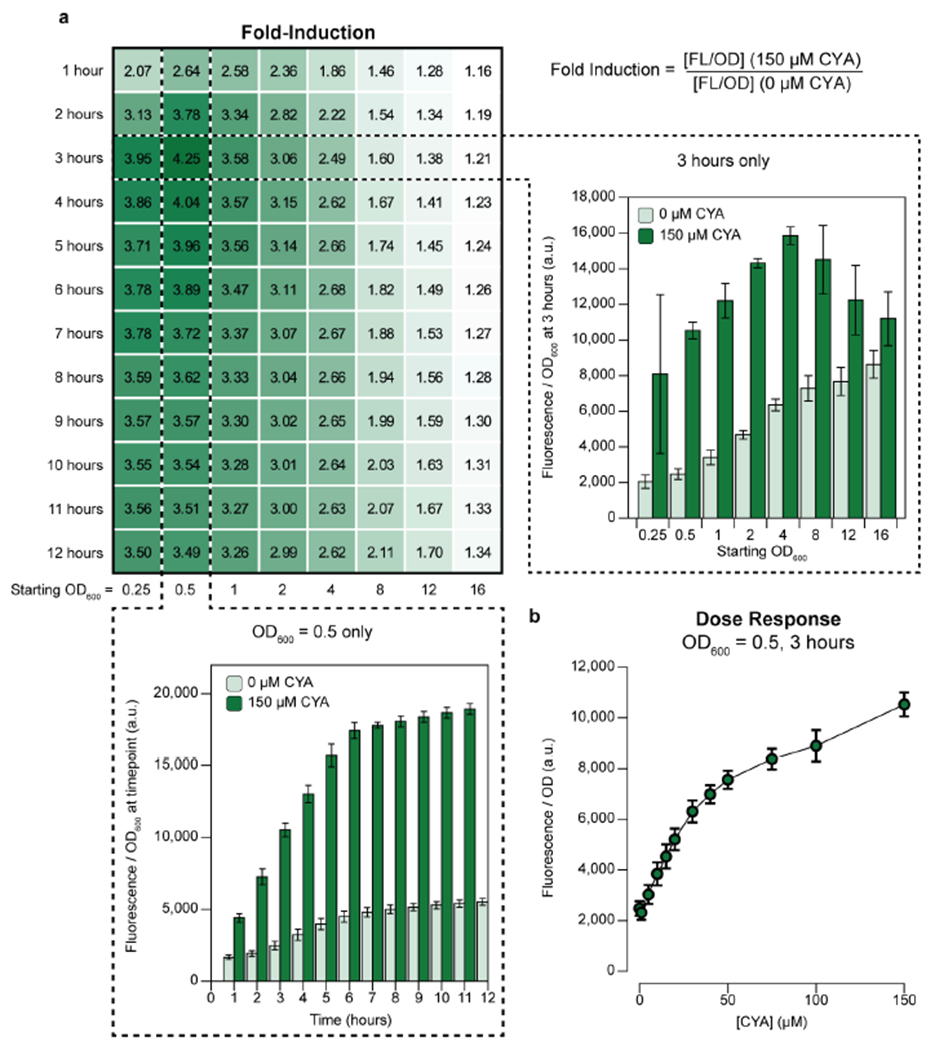
Figure 2. Performance of a whole-cell E. coli cyanuric acid sensor across time, optical densities, and CYA concentrations.

(a) Fold-induction of the whole-cell cyanuric acid (CYA) sensor measured as ratio of reporter fluorescence in the presence or absence of 150 μM CYA. The starting cell optical densities (OD600) ranged from 0.25 to 16. Timepoints were taken every hour for 12 hours post-induction with CYA, and fold induction reported at all time points. The OD600 normalized sfGFP fluorescence time course for starting OD600 0.5 is plotted with and without 150 μM CYA (bottom). The OD600 normalized sfGFP fluorescence for starting OD600 at 0.5 to 16 at the 3-hour timepoint is plotted with and without 150 μM CYA (right). (b) Dose-response curve of the sensor measured 3 hours post-induction for starting OD600 0.5. The OD600 normalized GFP fluorescence was taken from 0 to 150 μM CYA. All measurements were taken on 3 biological replicates. Averages are shown with error bars representing 1 standard deviation.
