
Figure 2.
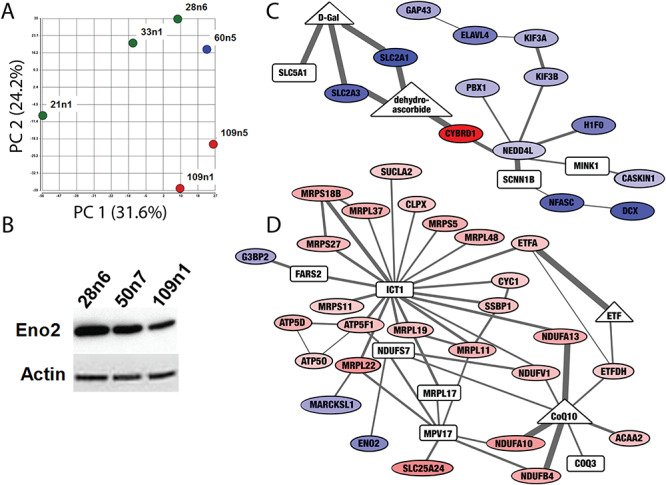
Proteomic screen of iPSC-derived striatal neural cells suggest differences in expression of metabolic proteins. (A) Principal component analysis of proteomic measurements in striatal neural cells produced as in (42) separates samples based on CAG repeat length. Control cell lines (21n1, 33n1 and 28n6) are green, the HD cell line with 60 CAG repeats is blue and HD cell line with 109 repeats are shown in red. (B) Western blot confirms decreased levels of Enolase 2 (ENO2) in HD neurons. Equal loading was verified by stain on Actin. (C and D) The Omics Integrator tool found subnetworks enriched for bioenergetics functions altered in these cells. Nodes indicate differentially expressed proteins (ovals) as well as `hidden nodes’: metabolites (triangles) and proteins (rectangles) which did not result from analysis of the proteomic screen, but were implicated by the network algorithm. Colors indicate proteins that are significantly downregulated (blue) and upregulated (red). Increased line thickness indicates higher confidence in the interaction between two molecules. The network in (C) contains downregulated glucose transporters, and the network in (D) contains upregulated components of the electron transport chain and several proteins involved in mitochondrial translation. The full interactive network can be viewed at http://fraenkel.mit.edu/omicsintegrator/iPSC_MSN/network.html.