
Figure 3.
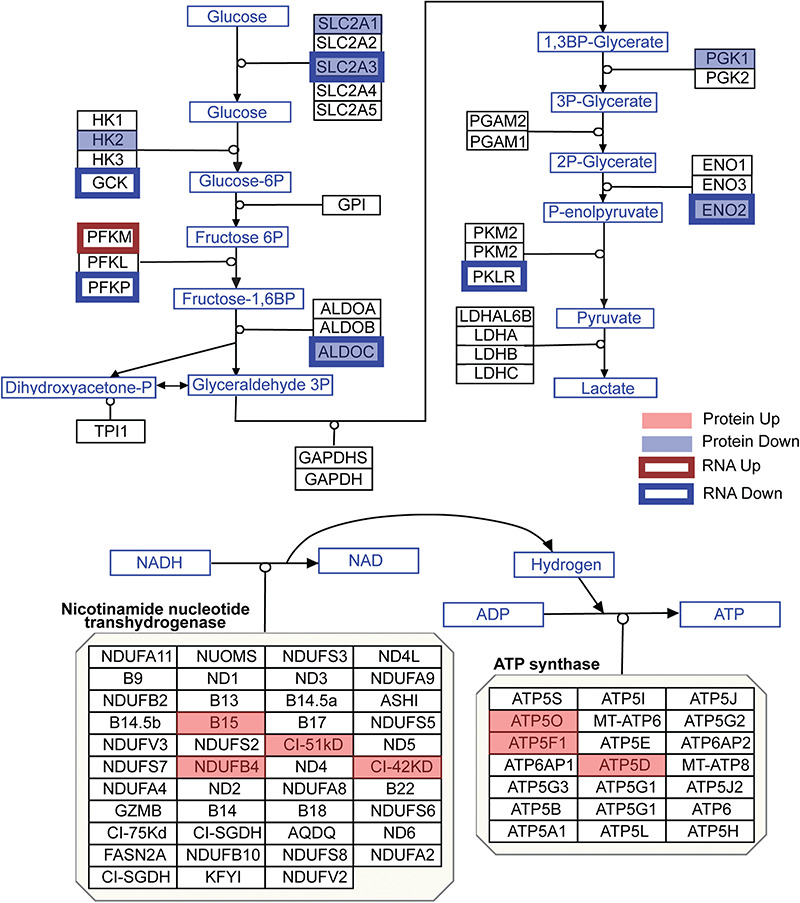
Protein and mRNA changes in the glycolysis and oxidative phosphorylation pathways. Pathway images are based on those by WikiPathways (49). A red box was overlaid over proteins that were significantly upregulated, while a blue box was overlaid over proteins that were significantly downregulated (moderated t-test P < 0.05). A red outline surrounds proteins whose mRNA was upregulated, while a blue outline surrounds proteins whose mRNA was downregulated (corrected P < 0.05). Changes to mRNA are derived from our previously published RNA-seq data in these cultures (42).