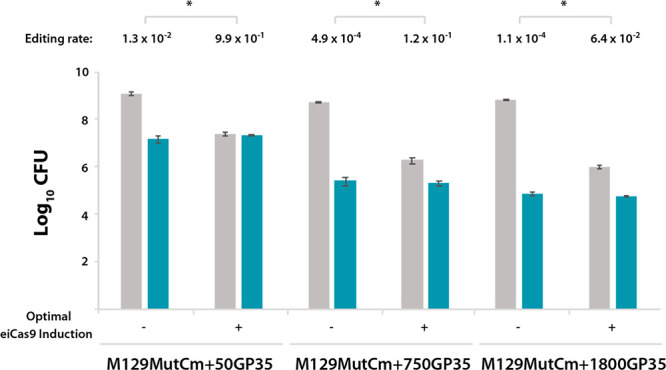
Figure 5.

Improvement of editing rates mediated by Cas9-based counterselection. Bar plot showing in logarithmic scale the CFU values obtained for the indicated recombineering sensor strains after transformation with their corresponding editing oligos and seeding on nonselective medium (gray bars) or selective medium (green bars), nonsupplemented with aTc (−) or supplemented with the optimal aTc dose for each strain (+) as indicated on the x-axis. The editing rate (edited cells/total cells) obtained for each strain and experimental condition is shown on top of each group of bars. Those differences in terms of editing rate that were found to be statistically significant (P < 0.05) after conducting a paired t test are indicated with an asterisk (*). Error bars represent the SEM of three different biological replicas.
