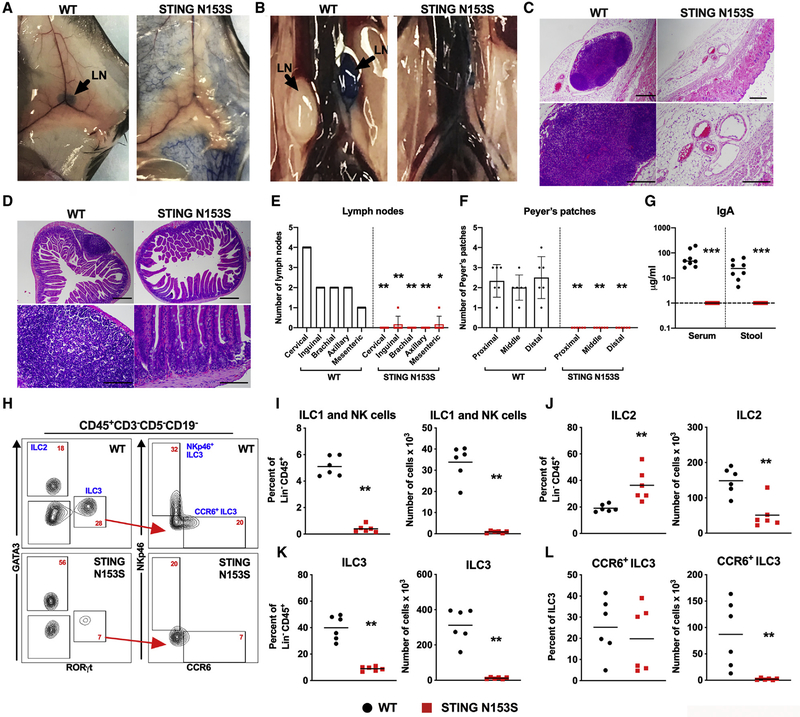
Figure 1. Absence of Lymph Nodes and Peyer’s Patches in STING N153S Mice.
(A and B) Representative photographs of WT (left panels) and STING N153S (right panels) animals 15 min after unilateral, subcutaneous footpad injection of Evans Blue dye. Inguinal lymph nodes (LNs) are shown in (A), and retroperitoneal LNs are shown in (B). Discernible LNs are marked by black arrows.
(C) Representative H&E staining of serial skin sections and inguinal fat pads of WT and STING N153S mice. Images are representative of 20 sections per mouse from three mice per genotype from two independent experiments. Scale bar: 200 μm.
(D) Representative H&E staining of serial sections from the small intestines of WT and STING N153S mice. n = 3 mice from two independent experiments. Scale bar: 200 μm.
(E and F) Total number of discernible cervical, inguinal, brachial, axillary, and mesenteric LNs (E) and Peyer’s patches (F). Data represent the mean of six STING N153S and six WT littermate control mice.
(G) IgA levels in the serum and stool of STING N153S and WT littermate animals were quantitated by ELISA. Data represent the mean of eight samples per genotype. Dashed line denotes the limit of detection.
(H–L) Flow cytometric analysis of intestinal leukocytes of 6-to-7-week-old STING N153S mice and WT littermate control animals. (H) Representative FACS dot plots of intestinal leukocytes, indicating the gating strategy for ILC2, ILC3, and LTi-like CCR6+ ILC3 populations. Numbers (red text) indicate the percent of CD45+Lin− cells in each gate (lineage markers: CD19, CD5, and CD3). Percent and total number of ILC1 and NK cells (NKp46+GATA3−RORγT−) (I), ILC2s (J), ILC3s (K), and LTi-like CCR6+ ILC3s (L).
Data represent the mean from n = 6 animals per genotype. All data were pooled from at least two independent experiments. Results were analyzed by Mann-Whitney U test. *p < 0.05; **p < 0.01; ***p < 0.001.

