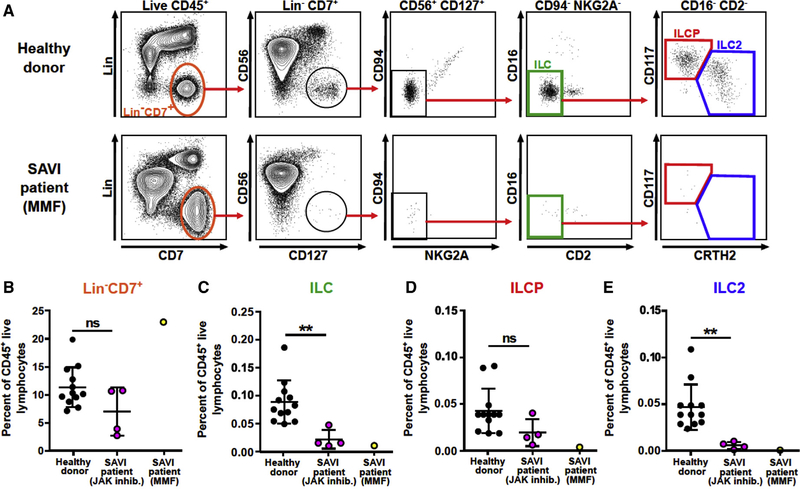
Figure 5. Quantitation of ILC and ILC Progenitor Cells in the Blood of Human SAVI Patients.
(A) Gating strategy and representative FACS plots of peripheral blood ILCP and ILC2 populations gated on the CD45+ live lymphocytes.
(B–E) Percent of total ILC & NK cells (Lin−CD7+) (B), total ILCs (CD56−CD127+CD94−NKG2A−CD16−CD2−) (C), ILCP (CD117+CRTH2−) (D), and ILC2 (CD117intCRTH2+) (E) as a frequency of CD45 live lymphocytes. Black dots (12 donors, left columns) denote healthy donors, purple dots (4 patients, middle columns) denote SAVI patients on JAK inhibitors (ruxolitinib), and yellow dots (1 patient, right columns) denote a SAVI patient on mycophenolate mofetil (MMF). Results were analyzed using unpaired t test. **p < 0.01.

