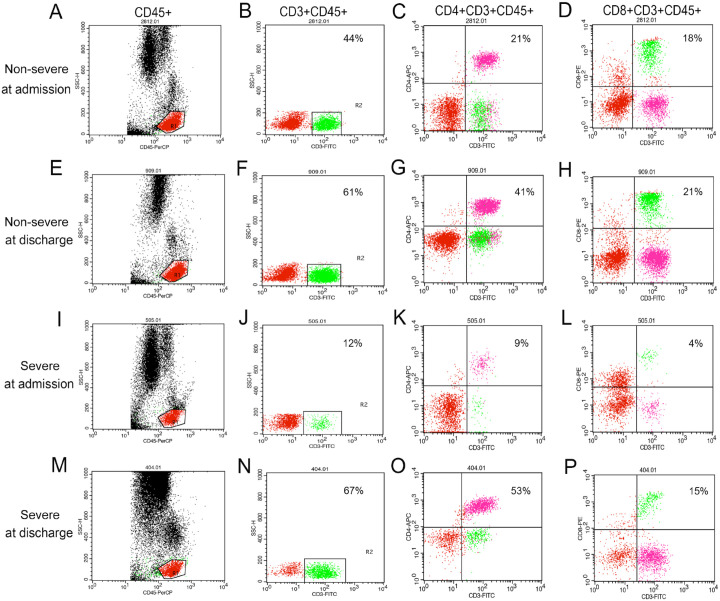
Figure 1.
Flow cytometry scatter plot of leukocytes from COVID-19 patients.
(A–P) Representative flow cytometry scatter plot of CD45+ (A, E, I, M), CD3+CD45+ (B, F, J, N), CD4+CD3+CD45+ (C, G, K, O), CD8+CD3+CD45+ (D, H, L, P) lymphocytes of COVID-19 patients: (A–D) representative flow cytometry scatter plot of one non-severe patient at admission; (E–H) representative flow cytometry scatter plot of the same non-severe patient at discharge; (I–L) representative flow cytometry scatter plot of one severe patient at admission; (M–P) representative flow cytometry scatter plot of the same severe patient at discharge. A–H represent one non-severe patient and the numbers indicate this non-severe patient’s percentages of lymphocytes. I–P represent one severe patient and the numbers indicate this severe patient’s percentages of lymphocyte. COVID-19, coronavirus disease 2019.

