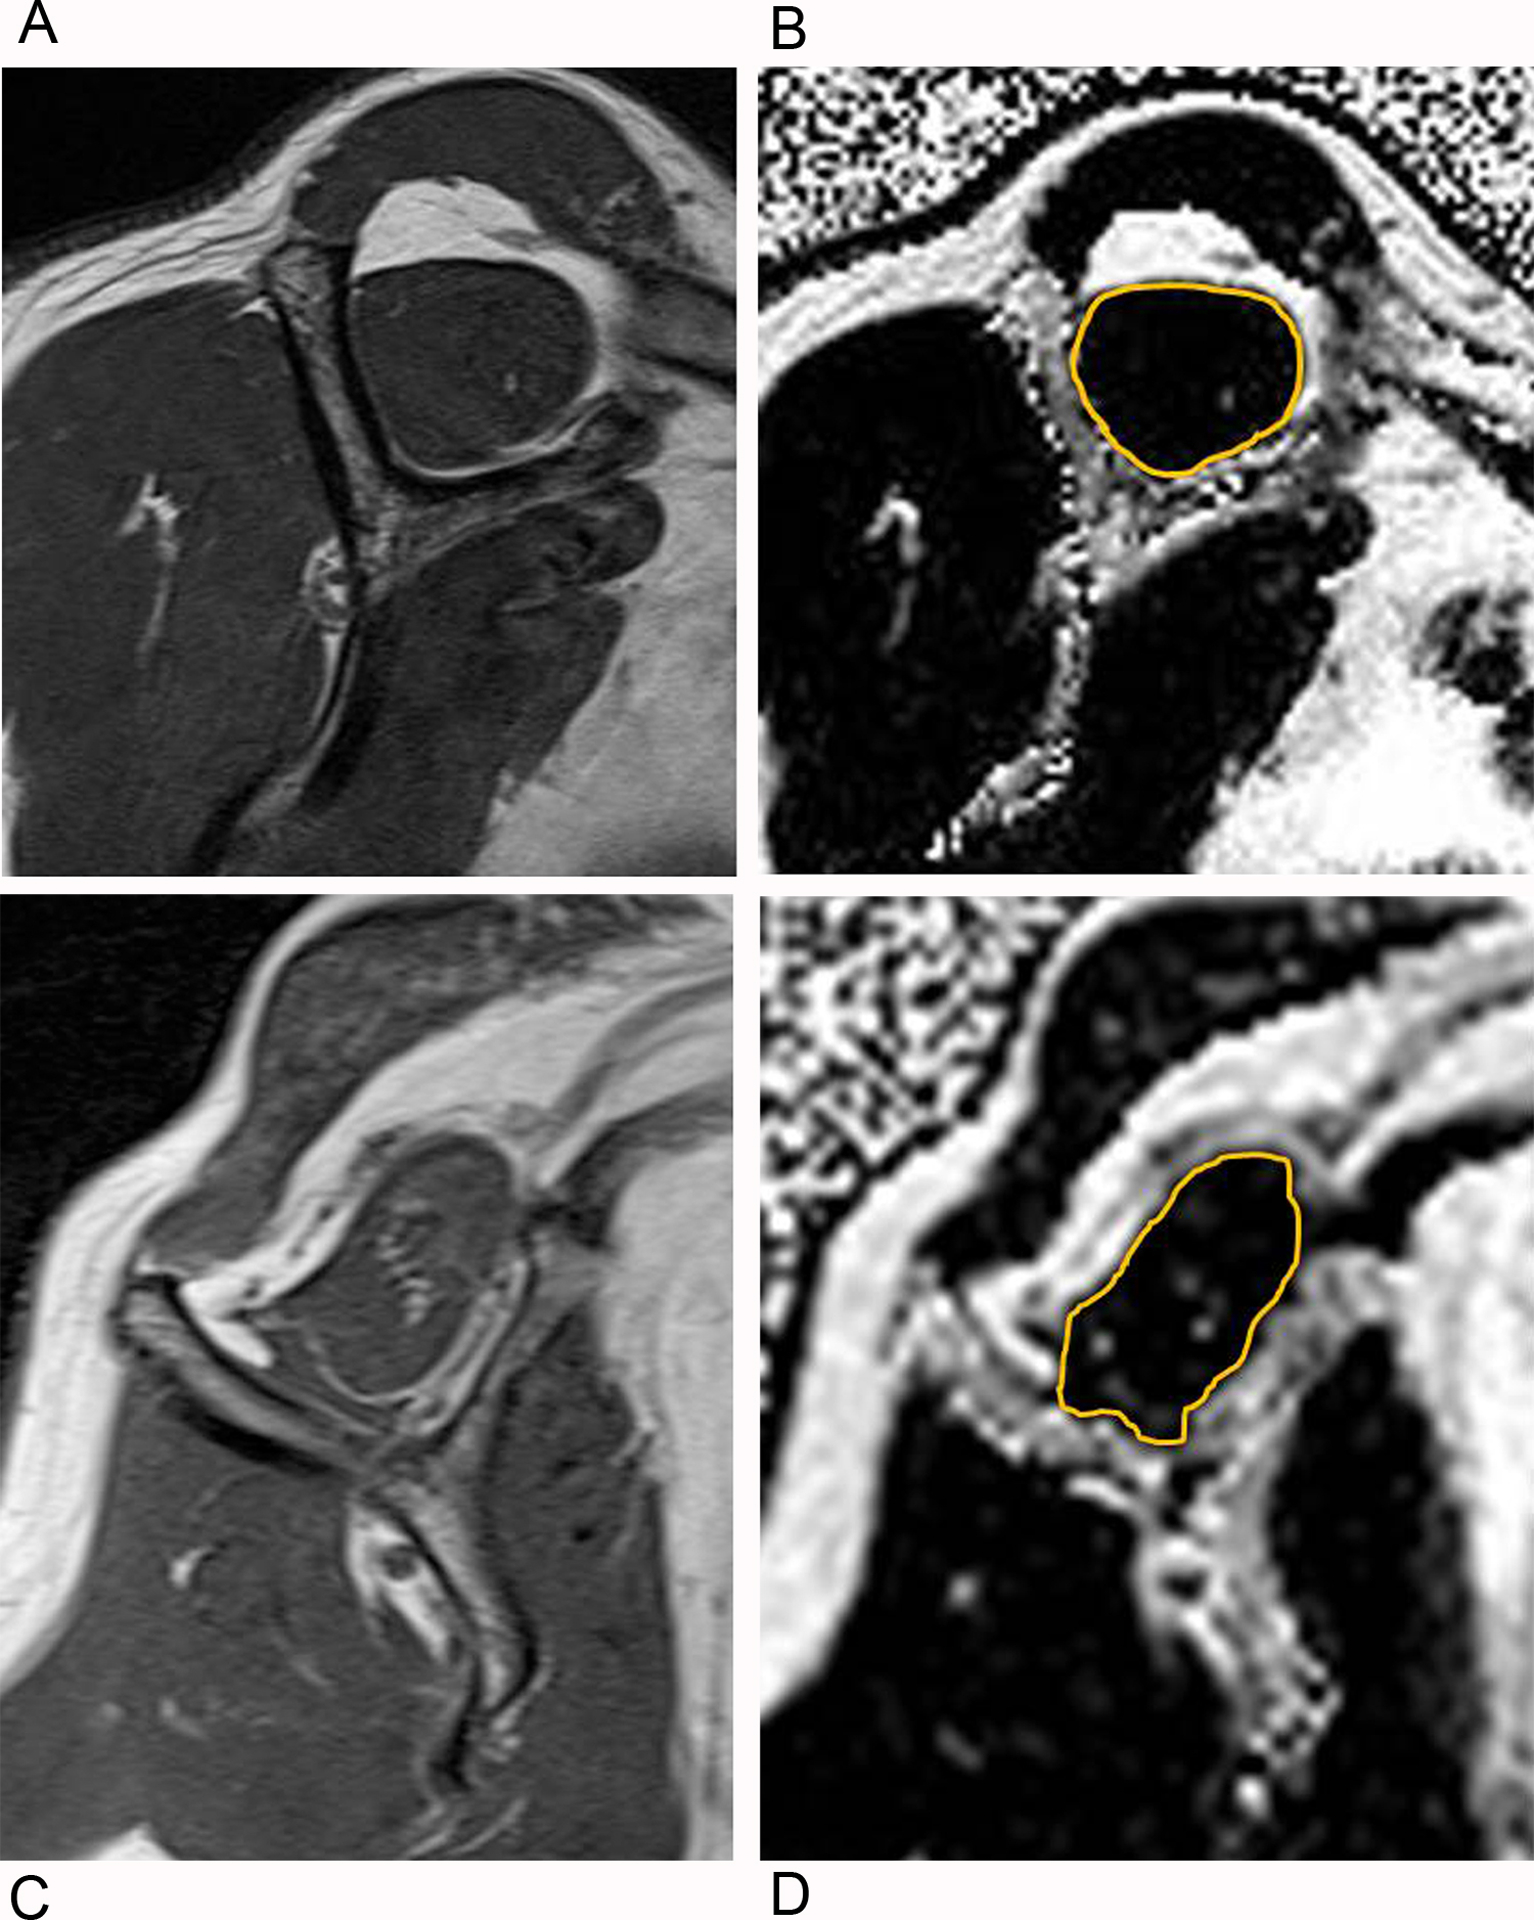
Fig. 2–

Example shoulder MR images from study participants with differing amounts of supraspinatus intramuscular fatty infiltration.
A and B. Example 1. Oblique sagittal T1-weighted MRI Y-shaped view for Goutallier grade (A) and oblique sagittal Dixon fat fraction map image (B), corresponding to the oblique sagittal T1-weighted MRI Y-shaped view . The gold outline about the supraspinatus muscle denotes the region of interest placed by manual segmentation for measurement of fat fraction.
C and D. Example 2. Oblique sagittal T1-weighted MRI Y-shaped view (C) and corresponding oblique sagittal Dixon fat fraction map image (D).
