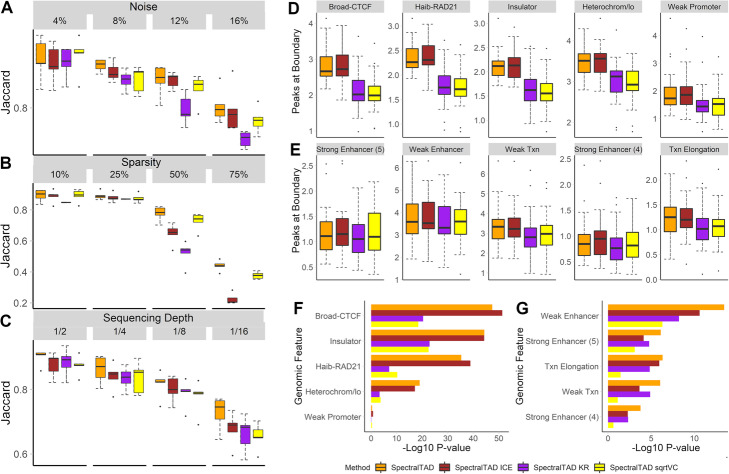
Fig. 2.
The effect of normalization on TAD consistency and enrichment. To test for robustness to noise, sparsity, and sequencing depth, simulated Hi-C matrices were used as-is, KR-, ICE- and square root VC-normalized. TADs detected by SpectralTAD were compared with the ground-truth TADs using the Jaccard similarity metric. The effect of normalization was assessed at different levels of noise (a, the percentage of the original contact matrix modified by adding a constant), sparsity (b, the percentage of the original contact matrix replaced with zero), and downsampling (c, the fraction of contacts kept, see Methods). Using the raw and normalized data from the GM12878 cell line at 25 kb resolution, enrichment of genomic annotations within 50 kb regions flanking a TAD boundary on both sides was assessed using a permutation test. The average number of annotations for enriched (d) and depleted (e) genomic features and the permutation p-values corresponding to enrichment (f), and depletion (g) for the top five most enriched/depleted genomic annotations are shown. Results averaged across chromosome 1–22 are shown

