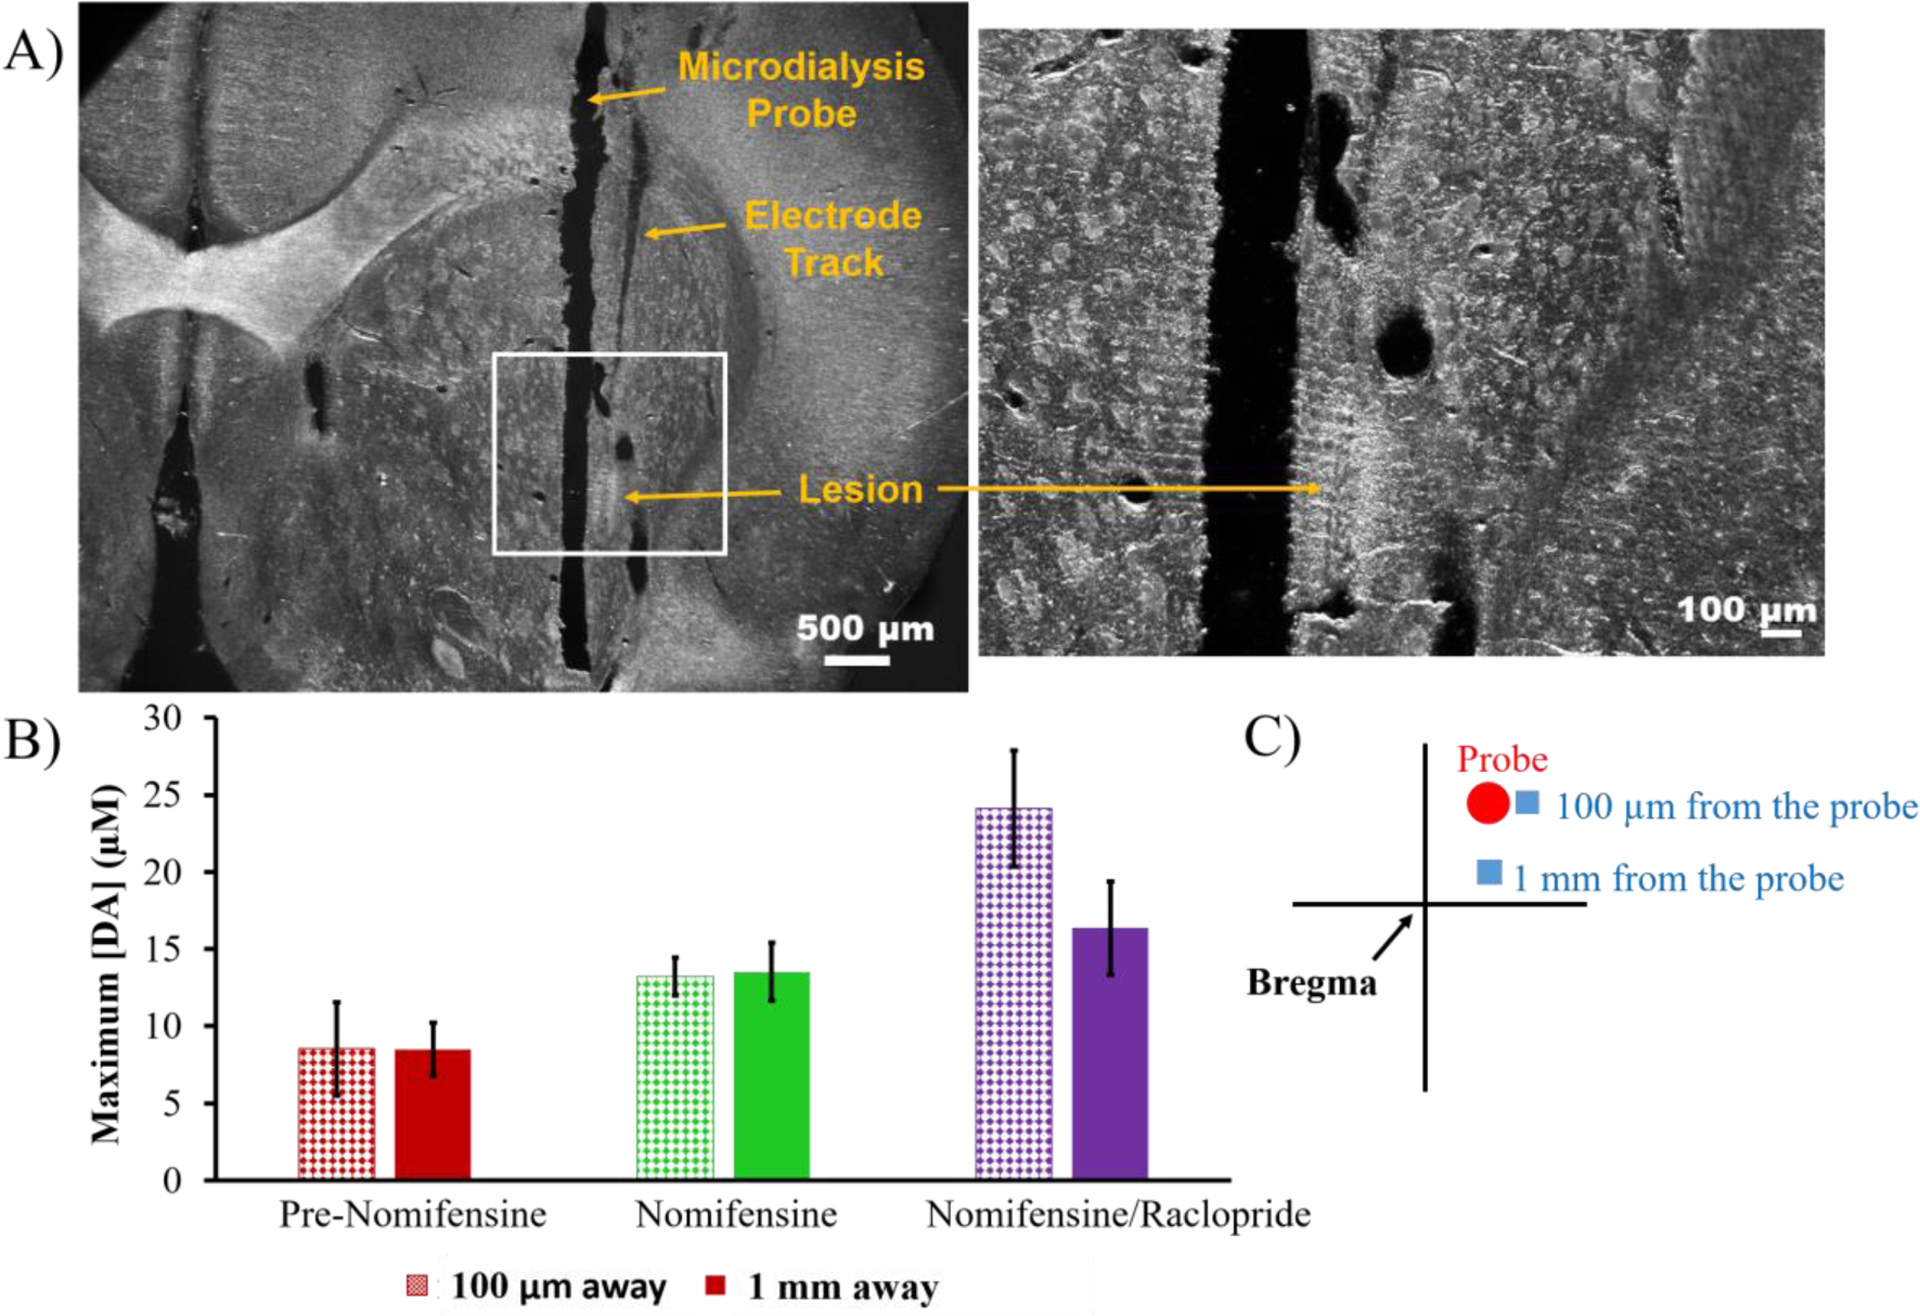
Figure 5.

A) An electrolytic lesion confirmed the placement of a carbon fiber electrode 100 μm from the microdialysis probe by applying a current of 20-μA for 5s to the electrode. The white box in the left image is magnified on the right. Scale bars are 500 μm (left) and 100 μm (right). B) Evoked release (mean ± SEM, n=4 per group) measured 100 μm (pattern) and 1 mm (solid) away from the probe after 5 days of DEXretro (responses in Figure S4). Statistical analysis was by two-way ANOVA for drug (pre-nomifensine, nomifensine, and raclopride, repeated measures) and location (100 μm, 1 mm). The drug was significant (F(1,6)=23.02, p<0.005) while the location and the interaction were not significant factors. C) Schematic of voltammetry next to the probe with the electrodes represented by blue boxes and the probe a red circle. The adjacent electrode was implanted at a 5° angle to allow the tip of the electrode to be placed 100 μm from the probe.
