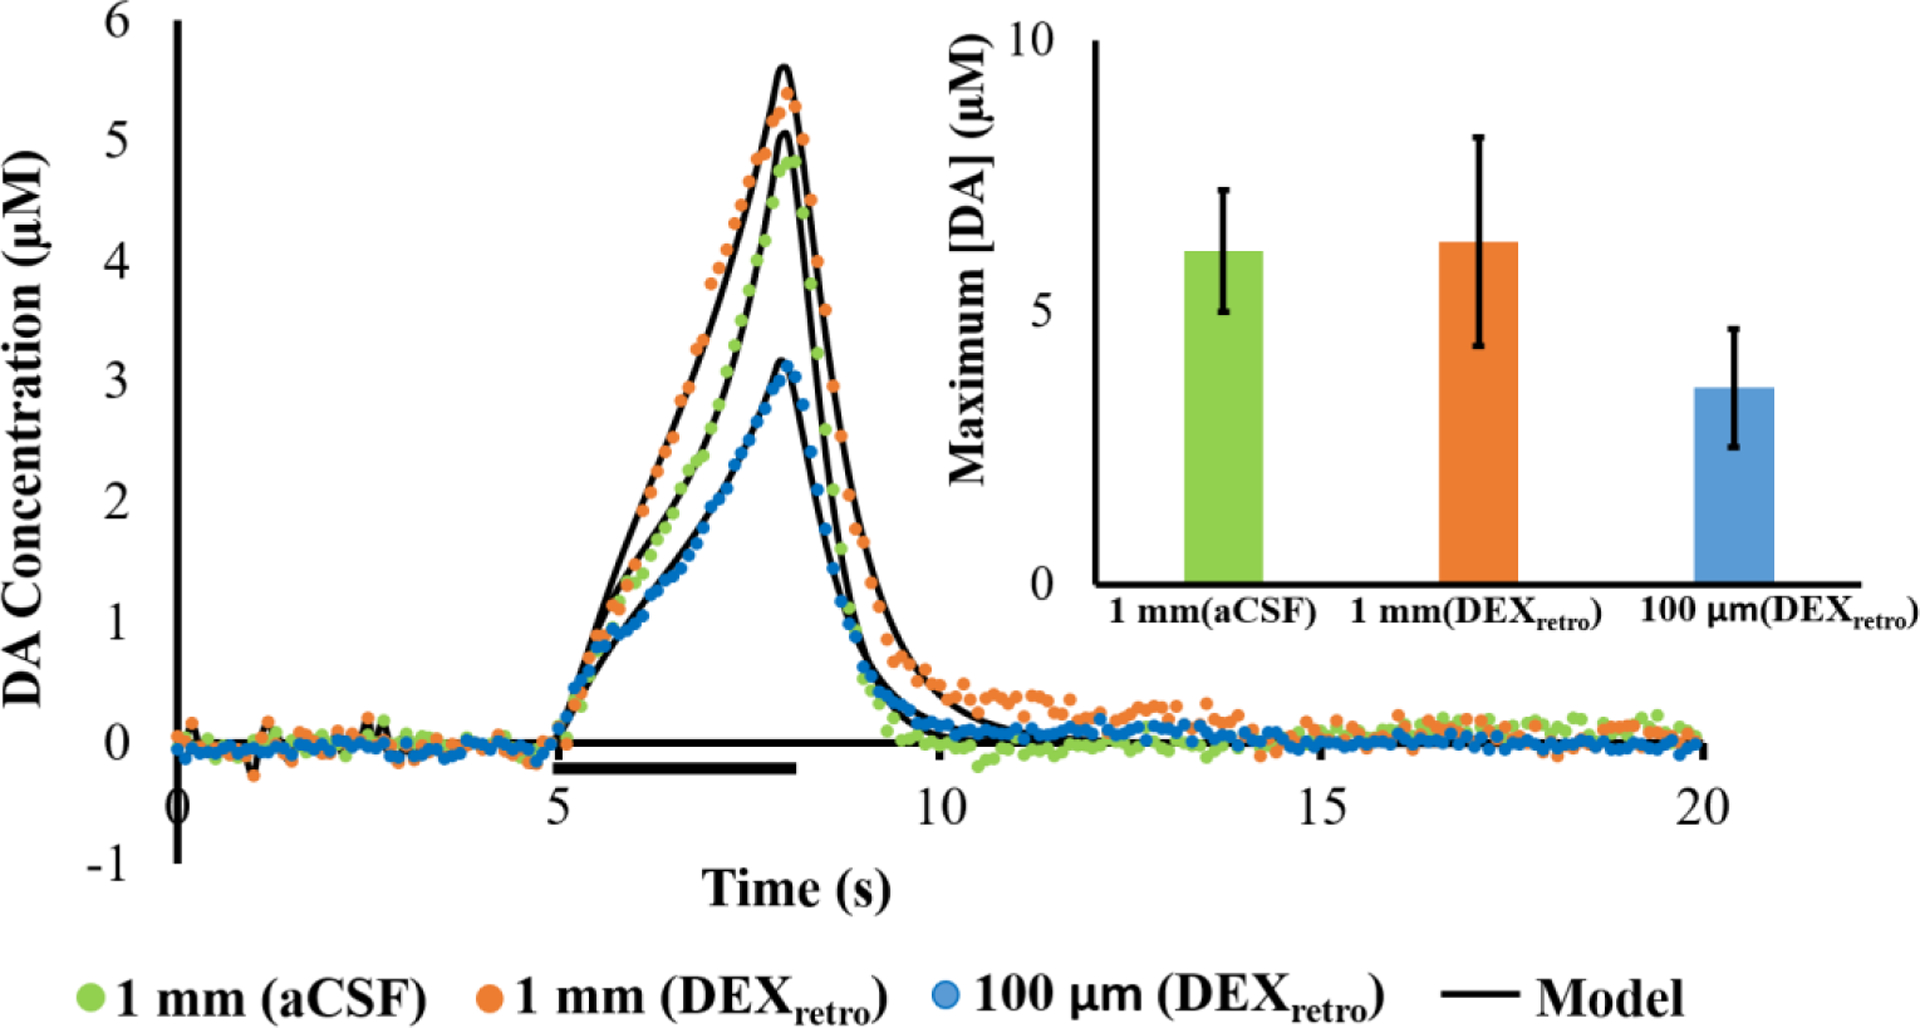
Figure 6.

Evoked release (mean, n=4 per group) measured 1 mm away without (green) and with (orange) DEXretro, and 100 μm from the probe with DEXretro (blue): error bars are emitted for clarity. The stimulus in this case was for 3 s (marked by the horizontal black bar) at 60 Hz. The black lines report the average of the model fits to each individual response. The average values of the kinetic parameters (see Table S1) exhibited no significant differences (multivariate ANOVA, Pillai’s Trace). The inset shows the response amplitudes, which are not statistically different (one-way ANOVA).
