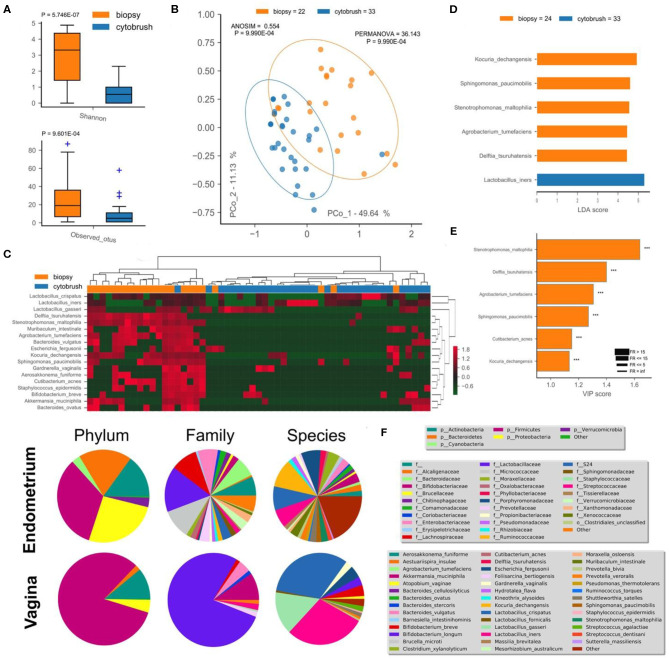
Figure 1.
Endometrial (biopsy) and vaginal (cytobrush) tissues harbor a different microbiota composition. Alfa-diversity measurements of biodiversity (Shannon) and richness (observed OTUs) were assessed (A), along with beta-diversity (unsupervised PCoA—B, unsupervised HCA—C). Percentage of variance embraced by each new coordinate is reported in percentage for each axis. Ellipses describing the 95% of confidence are depicted for each cohort. ANOSIM and PERMANOVA metrics were implemented with 999 permutations to assess differences. Hierarchical Clustering Algorithm (HCA) and Principal Coordinate Analysis (PCoA) were based on Bray-Curtis distance metrics and normalized/standardized bacterial relative abundances. Supervised LEfSe (D) and PLS-DA VIP (E) were used to find bacterial biomarkers. Variable Importance Plot (VIP) was implemented within Partial Least Square Discriminant Analysis (PLS-DA), describing the most discriminant species in descending order of importance. Each bar reports the following information: (i) length, VIP score; (ii) bar color, cohort in which the species has the highest mean relative abundance (high); (iii) edge color, cohort in which the species has the lowest mean relative abundance (low); iv) thickness, Fold Ratio (FR) among high and low; (v) significance of Mann-Whitney U-test among high and low (***P ≤ 0.001, ns, not significant). Mean relative abundance of microbiota at phylum, family, and species levels are reported as pie charts to provide a visual snapshot of the microbiota composition (F).

