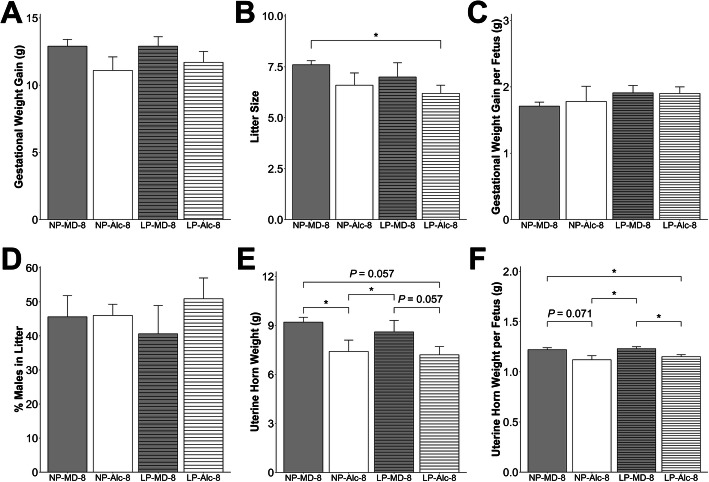
Fig. 5.
Effect of gestational alcohol exposure and maternal protein intake on gestational weight gain (a), litter size (b), gestational weight gain per fetus (c), percent males in litter (d), uterine horn weight (e), and uterine horn weight per fetus (f). Data for the NP-MD-8 and NP-Alc-8 groups are from Fig. 2 and are presented here for comparison purposes. Data were analyzed using two-way ANOVA, and post hoc pairwise comparisons were analyzed using pairwise t test with Benjamini-Hochberg correction. Values are presented as means ± SEMs (a, c–f) or mean ± SD (b). n = 9 dams for NP-MD-8, LP-MD-8, and LP-Alc-8 groups, and n = 8 dams for NP-Alc-8 group. Asterisk (*) denotes statistical significance (P < 0.05) for the indicated comparison. Abbreviations: Alc, alcohol; LP, low protein; MD, maltodextrin; NP, normal protein

