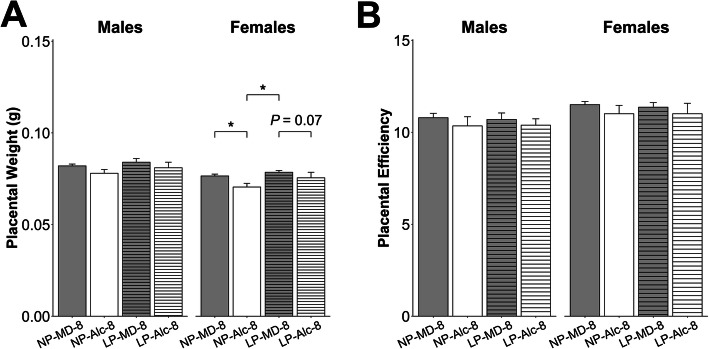
Fig. 6.
Effect of gestational alcohol exposure and maternal protein intake on placental weight (a) and placental efficiency (b). Data for the NP-MD-8 and NP-Alc-8 groups are from Fig. 3 and are presented here for comparison purposes. Data were analyzed separately for males and females using mixed linear model followed by post hoc Benjamini-Hochberg corrections to adjust for multiple comparisons. Values are presented as means ± SEMs. n = 9 litters for NP-MD-8, LP-MD-8, and LP-Alc-8 groups, and n = 8 litters for NP-Alc-8 group. Asterisk (*) denotes statistical significance (P < 0.05) for the indicated comparison. Abbreviations: Alc, alcohol; LP, low protein; MD, maltodextrin; NP, normal protein

