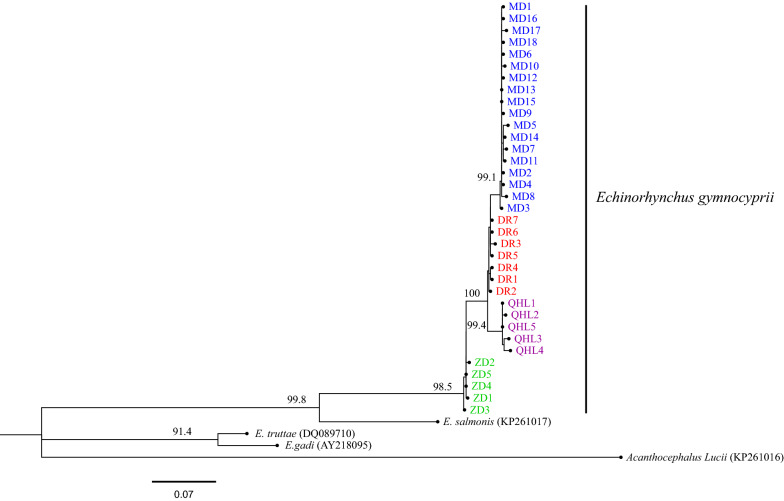
Fig. 3.
Phylogenic tree based on cox1 gene sequences of E. gymnocyprii using the maximum likelihood (ML) method. Bootstrap support is shown above the nodes. The scale-bar indicates the number of substitutions per site. Branch labels of different colors indicate different locations of E. gymnocyprii populations in this study (blue, Maduo County (MD); red, Dari County (DR); purple, Qinghai Lake (QHL); green, Zhiduo County (ZD).) Acanthocephalus lucii was used as the outgroup. The branches of the phylogram depicting the relationships among the E. gymnocyprii sequences are shown in Additional file 4: Figure S1

