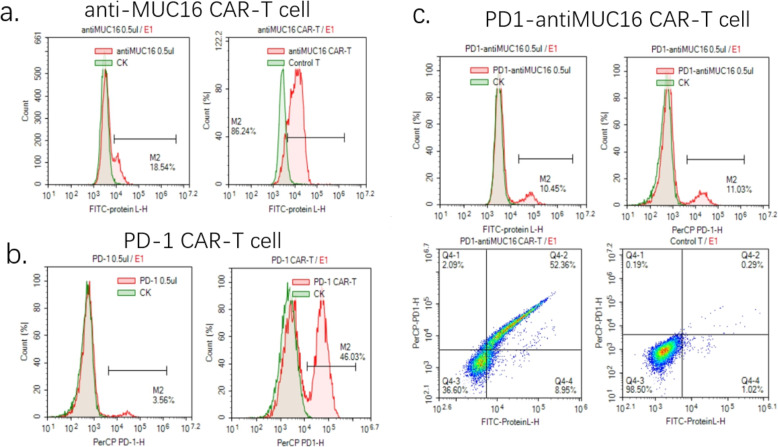
Fig. 3.
Detection results of the positive rate of single and dual CARs on T cells. a The testing results of viral titer and infection rate of anti-MUC16 CAR-T cell. Anti-MUC16 CAR-T cells stained with 10 μL FITC-Protein L antibody for 30 min in the dark, followed by detecting via flow cytometry. The green peak is the control group, and the red peak is the experimental group. b The detecting results of viral titer and infection rate of PD1 CAR-T cell. PD1 CAR-T cells stained with 5 μL Percp-cy5.5 antihuman PD-1 antibody for 30 min in the dark, followed by detecting via flow cytometry. c The testing results of viral titer and infection rate of PD1-antiMUC16 CAR-T cell. Control T showed both negative results stained with two antibodies. However, PD1-antiMUC16 CAR-T showed both positive results with two antibodies

